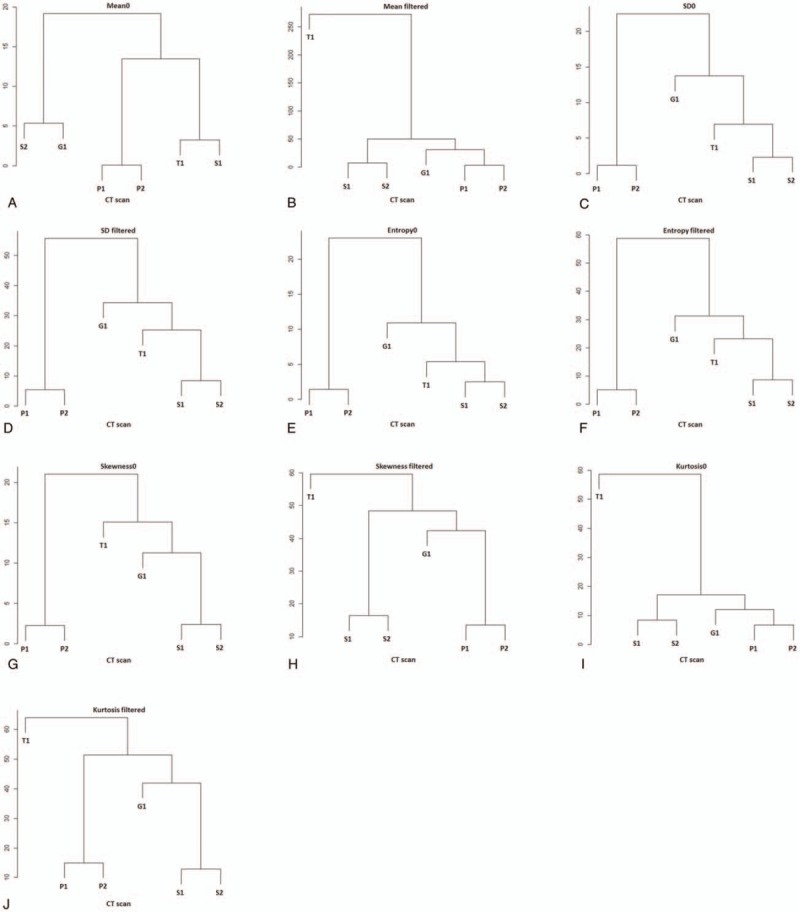
Figure 3.

Hierarchical clustering dendrograms for parameters in unfiltered and filtered images. Note that the S1 and S2 or P1 and P2 are clustered closest for all dendrograms indicating that the effect of tube current (P1 vs P2) and tube voltage (S1 vs S2) on parameters is relatively small compared with that of computed tomography scanner, except for mean0 (A).
