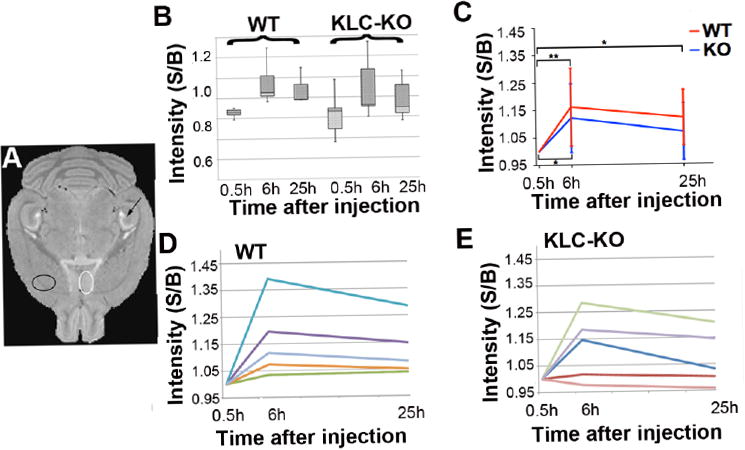
Figure 5. Region of interest analysis (ROI).

A. Locations selected for ROI analysis shown on a high-resolution template image for anatomy. White circle indicates the MSN, a location with increased intensity that differed between KLC-KO and their WT littermates as observed by visual inspection of the averaged images (Figure 3) and in T-maps of within-group between time-points (Figure 4). Black circle indicates the “control” region that had no signal by SPM and lies outside the CA3-septal circuit on the contralateral side from the injection. B. Box plot shows the distribution of background-corrected intensities in the MSN of WT and KLC-KO mice at each time-point. Data has been normalized. S/B = ratio of signal to background. C. Average intensities are shown for background-corrected, equalized data at each time-point in the WT (red) and in KLC-KO (blue). Intensity measurements were background-corrected and equalized by setting the 0.5 hour signal/background to 1.0. Error bars indicate standard deviation of the WT at 6 hours and 25 hours. Mixed model ANOVA with Tukey’s post-hoc analysis was used to determine significance within genotype between time-points on this corrected/equalized data. One asterisk indicates p<0.05; two asterisks indicate p<0.01. S/B = ratio of signal to background. D. and E. Line graphs showing intensity increases in background-corrected, equalized measurements over time for each animal. Each individual is represented by a different color. D, wild type (WT); and E, KLC-KO. S/B = ratio of signal to background.
