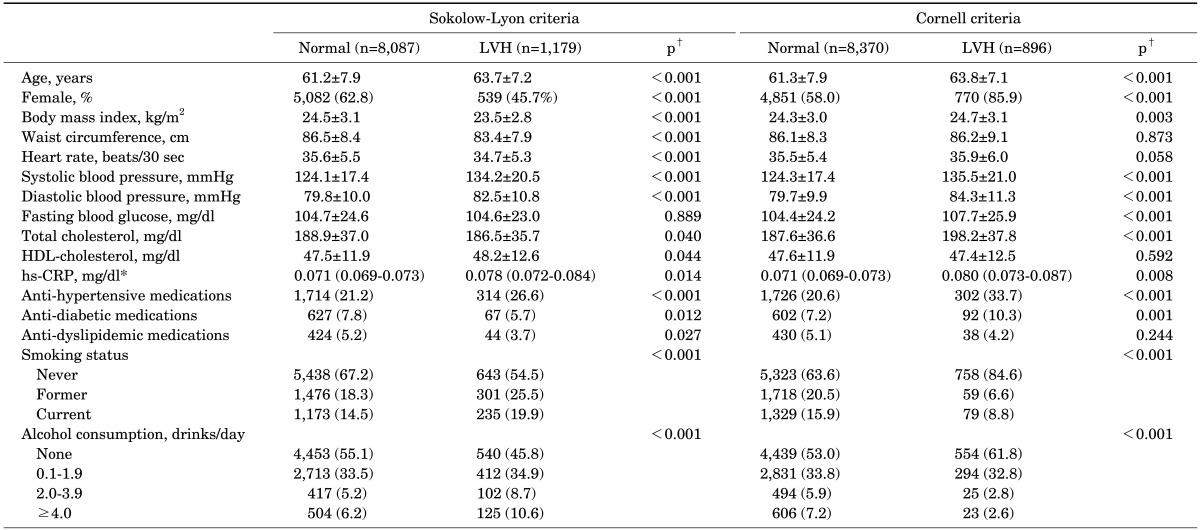
TABLE 2. Baseline characteristics according to the presence of LVH.
Values are expressed as means ± standard deviation or geometric means (95% confidence intervals)* for continuous variables, and frequency (percentage) for categorical variables.
LVH, left ventricular hypertrophy; HDL, high-density lipoprotein; hs-CRP, high sensitivity C-reactive protein.
†p-values were obtained using analysis of variance for continuous variables and the chi-square test for categorical variables.

