
Figure 6.
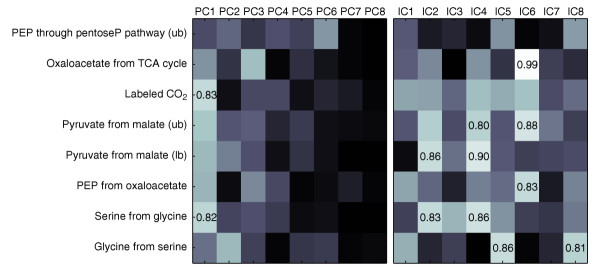
Correlation between analytically derived metabolic flux ratios (on the y-axis) [19] and the projections of the data on the first eight components obtained by PCA and ICA for the [U-13C]glucose experiment with ammonium. The brightness reflects the correlation coefficient, with black and white corresponding to values of 0 and 1, respectively. For coefficients higher than 0.8, the numerical value is reported. ub, upper bound; lb, lower bound.