
Figure 6.
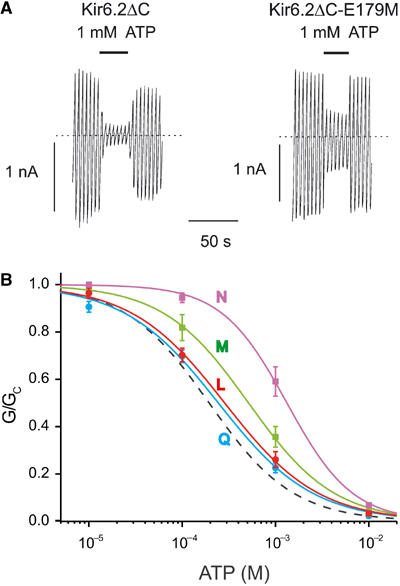
(A) KATP currents elicited by voltage ramps from −110 to +100 mV to an inside-out patch excised from a Xenopus oocyte expressing Kir6.2ΔC or Kir6.2ΔC-E179M. The dotted line indicates the zero current level. (B) Mean relationship between [ATP] and KATP conductance (G), expressed relative to the conductance in the absence of nucleotide (Gc) for Kir6.2ΔC with E179 mutated to N ( , n=5), M (
 , n=5), L (
 , n=5) and Q (
 , n=7). The curves are the best fit to equation (1), using values for IC50 and h given in Table I. The dashed line indicates the wild-type data.