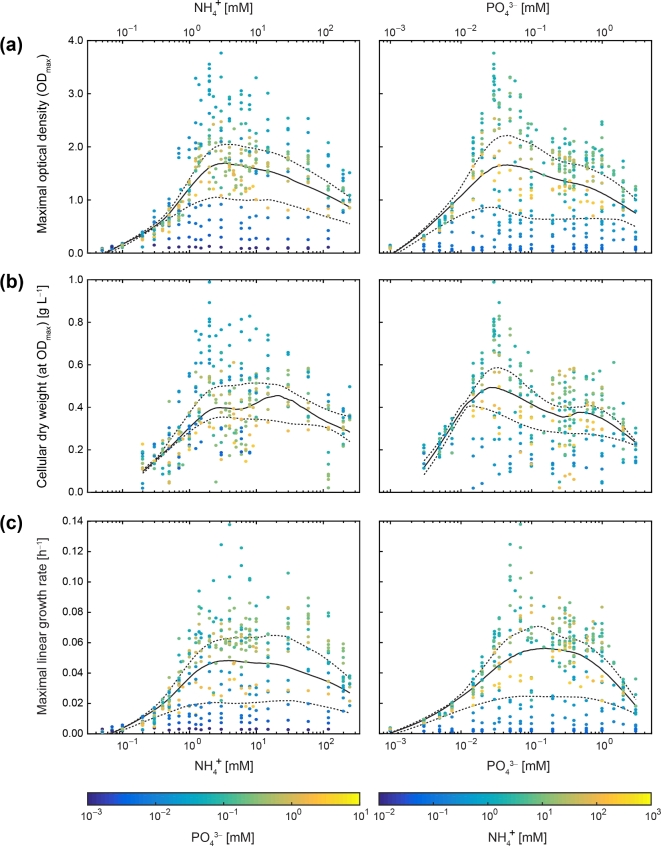
Figure 3.
Median of growth parameters across NH4+ and PO43− concentrations. Semilogarithmic profiles of (a) maximal optical density (ODmax), (b) cellular dry weight at ODmax and (c) maximal linear growth rate (μlin) for P. inhibens as a function of NH4+ or PO43− concentration (see Fig. 2b–d for joint display in color maps). Colors of data points indicate the corresponding NH4+ or PO43− concentration, respectively. The black solid line displays the calculated median and the dashed ones the 25% and 75% quantiles (based on 2D LOWESS fit to experimental data). A complementary fitting of a Monod function to the experimental data is shown in Fig. S5 (Supporting Information).

