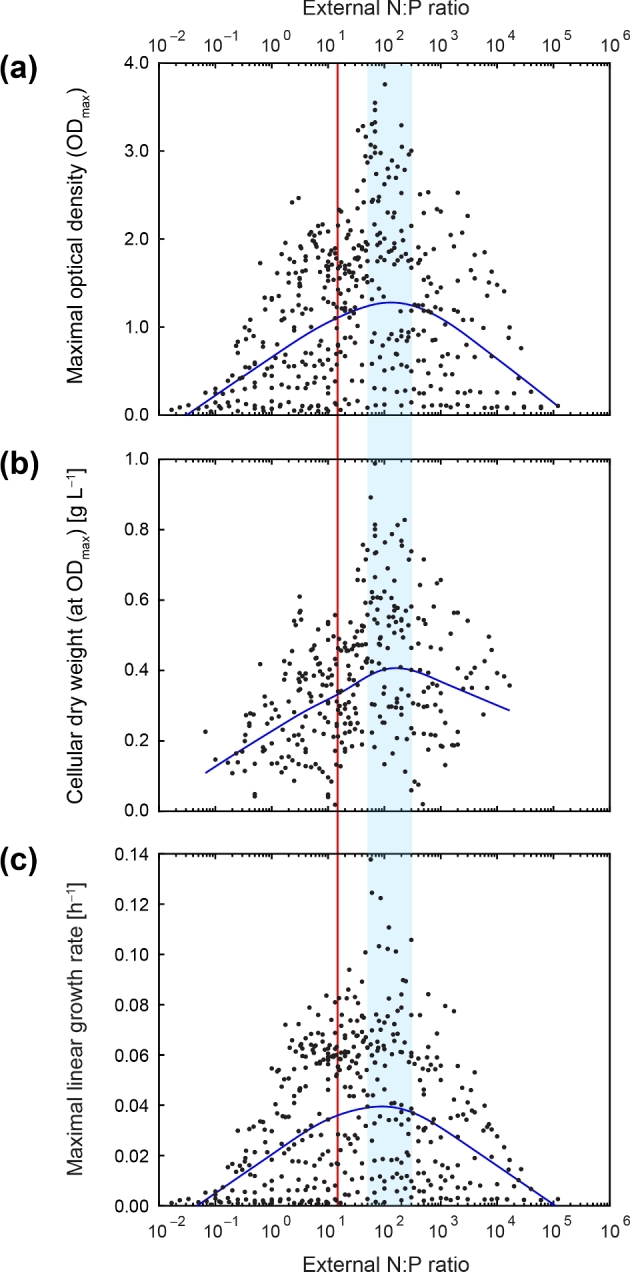
Figure 4.

Mean of growth parameters across the N:P supply ratios. Semilogarithmic profiles of (a) maximal optical density (ODmax), (b) cellular dry weight at ODmax and (c) maximal linear growth rate (μlin) for P. inhibens as a function of the external N:P ratio. The blue line displays the calculated mean (based on 2D LOWESS fit) for the experimental data (black dots). The vertical red line marks the Redfield N:P ratio of 16:1. The blue shaded area delimits the approximate range of N:P supply ratios (∼50–120), at which the mean of the studied growth parameters was maximal.
