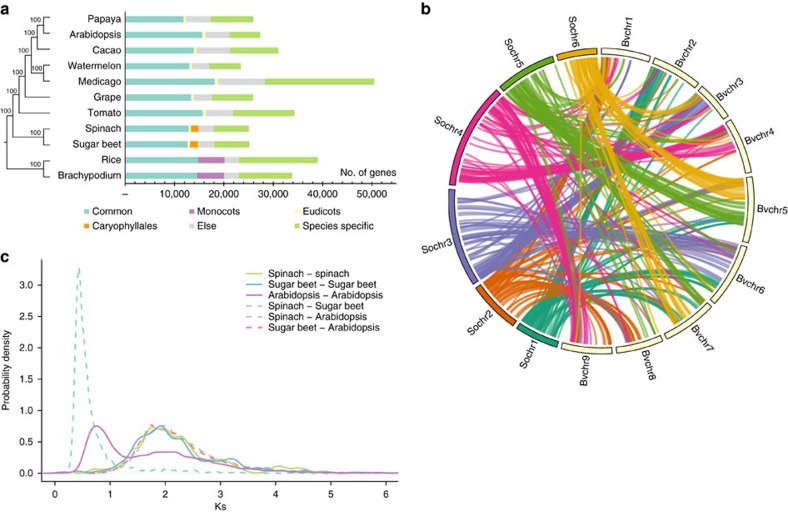
Figure 2. Comparative genomic analysis among spinach and other plant species.
(a) Phylogenetic relationship and gene clusters of 11 plant species. A maximum parsimony (MP) species tree (left) was constructed using protein sequences of the 2,047 single-copy genes. Bars (right) represent the number of genes in different categories for each species. Common: genes that are found in at least 10 of the 11 species. Monocots: genes that are only found in the two monocots, rice and Brachypodium; Eudicots: genes that are found in at least eight of nine eudicots but not in the two monocots; Caryophyllales: genes that are only found in spinach and sugar beet; Species-specific: genes with no homologues in other species. (b) Syntenic relationships between spinach and sugar beet genomes. (c) Ks distribution of homologous gene pairs in spinach, sugar beet and Arabidopsis. The probability density of Ks was estimated using the ‘density' function in R.

