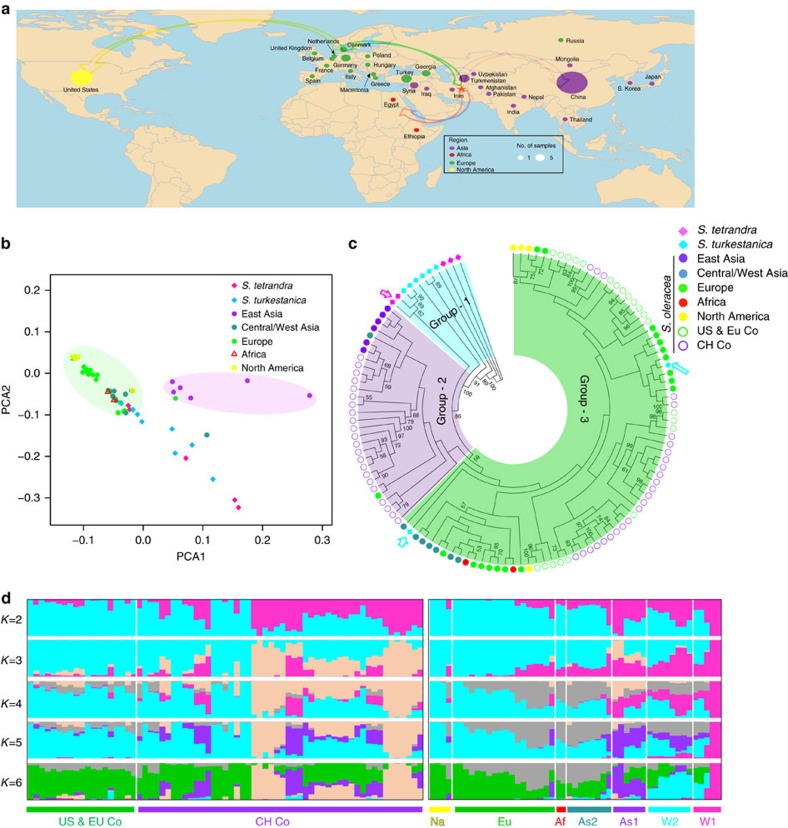
Figure 3. Geographic distribution and population structure of the 120 spinach accessions.
(a) Geographic information of the 120 accessions. The number of samples is represented by the dot size on the world map. The red star indicates the suggested origin location of spinach, and the arrows suggest the domestication history of spinach. Commercial cultivars provided by Chinese seed companies are plotted in China and commercial cultivars provided by American/European companies are plotted in United States. (b) PCA plot of non-commercial spinach accessions. (c) Phylogenetic tree of all spinach accessions inferred from transcriptome SNPs, with S. tetrandra Sp42 and Sp43 as the outgroup. The pink arrow indicates the two S. tetrandra (Sp39 and Sp40) that were grouped to S. turkestanica and the blue arrows indicate the two S. turkestanica (Sp47 and Sp48) that were clustered with cultivars. (d) Model-based clustering analysis of the 51 non-commercial (right) and 69 commercial (left) spinach accessions, given different number of groups (K=2 to 6). The y axis quantifies subgroup membership, and the x axis shows different accessions. W1: S. tetrandra; W2: S. turkestanica; As1: East Asia; As2: Central/West Asia; Eu: Europe; Af: Africa; Na: North America; CH Co: companies in China; US & EU Co: companies in United States and Europe.

