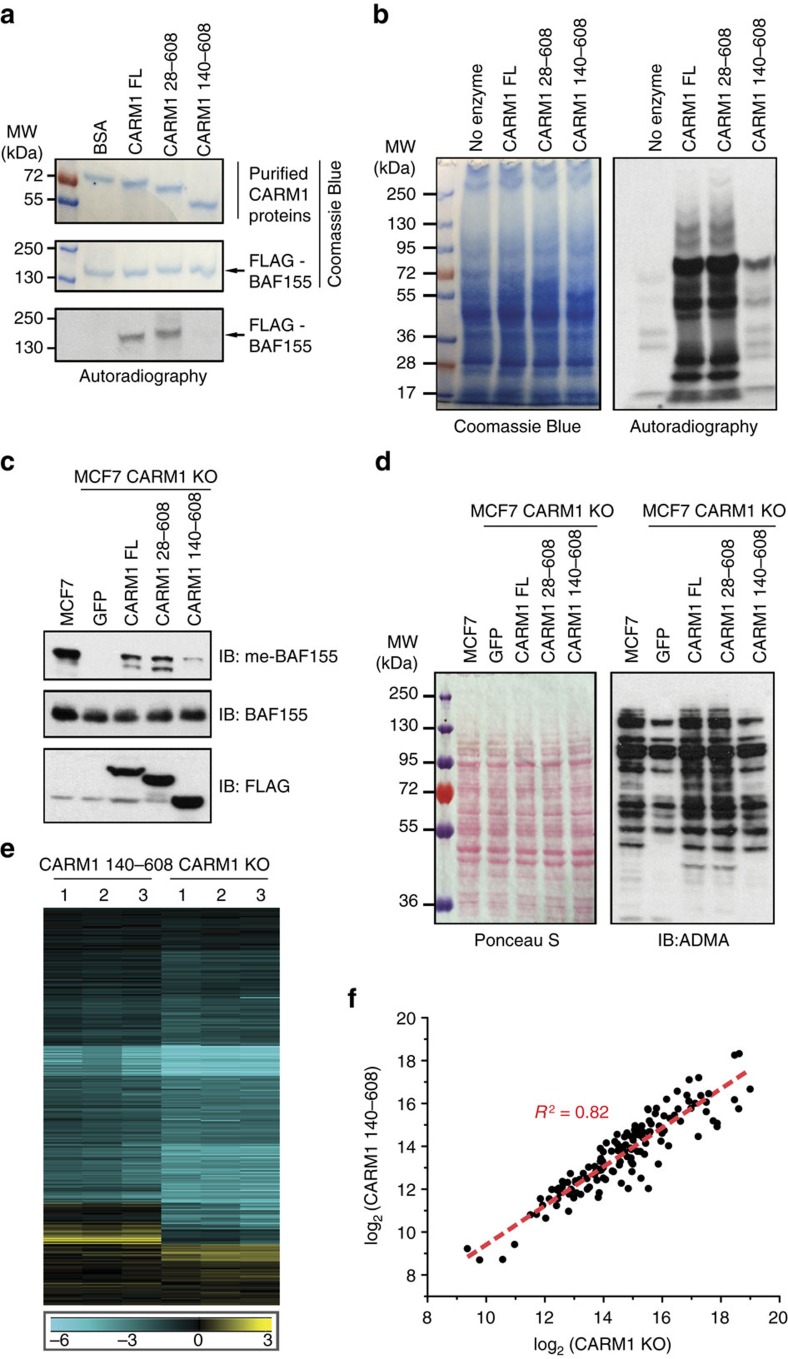
Figure 4. In vitro and in vivo requirement of the N-terminal domain for substrate methylation by CARM1.
(a) In vitro methylation assays using recombinant CARM1 proteins and 3H-SAM to test methylation of FLAG-BAF155 protein. Coomassie Brilliant Blue staining of purified BSA (control), FL CARM1, the N-terminally truncated CARM1 28–608 and 140–608, and FLAG-BAF155 are shown in the top two panels. Radioactive labelling of BAF155 is visualized using autoradiography after in vitro methylation assays. (b) In vitro methylation assay using recombinant CARM1 proteins, 3H-SAM and total cell lysates derived from MCF7 CARM1 KO cells. Coomassie Brilliant Blue staining (left panel) and autoradiograph (right panel) of total cell lysates after in vitro methylation assays are shown. (c) Western blot analyses of in vivo methylated BAF155 in parental MCF7 or MCF7 CARM1 KO cells stably expressing GFP control, CARM1 FL, CARM1 28–608 or CARM1 140–608. Expression of CARM1 in total cell lysates was detected by anti-FLAG antibody (bottom panel) and the levels of me-BAF155 (top panel) and total BAF155 (middle panel) were detected using corresponding antibodies. (d) Western blot analyses of ADMA-containing proteins in the total cell lysates as described in c. While Ponceau S staining (left panel) confirms equal loading, Western blot (right panel) demonstrates the reduced levels of ADMA in GFP control and CARM1 140–608 expressing cells, as compared with those in parental cells and cells expressing CARM1 FL and CARM1 28–608. (e) Heat map displaying hierarchical clustering of log2 transformed ADMA peptide intensities in complete CARM1 KO MCF7 cells and CARM1 KO, CARM1 140–608 expressing MCF7 cells, using three biological replicas of each. The intensities were normalized to their average respective levels in CARM1 KO, CARM1 28–608 expressing MCF7 cells. The ADMA peptides were prepared and quantified via nanoLC-MS/MS analysis, as described in Fig. 1a. (f) Comparison of the abundance of ADMA-containing peptides in CARM1 KO MCF7 cells and CARM1 KO MCF7 cells expressing CARM1 140–608. A close Pearson correlation in the levels of ADMA-containing peptides was detected in two cell lines (R2 of 0.82).

