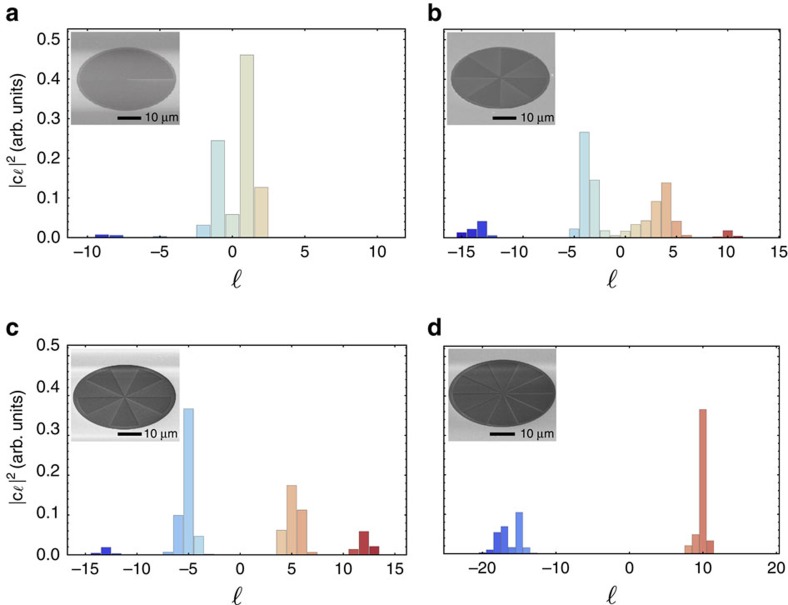
Figure 2. Experimental OAM spectra of electron beams.
Spectrum of a beam consisting of electrons defined by: (a) OAM of +1, ψ+1, produced with a spiral phase plate; (b) a superposition of ±4 OAM states,  , generated by a phase mask; (c) a superposition of ±5 OAM states,
  , generated by a phase mask; and (d) OAM of +10, ψ+10, produced by a spiral phase plate. Scanning electron microscopy (SEM) images of the devices used to generate the analysed electron beams are provided in the insets of their respective spectra.

