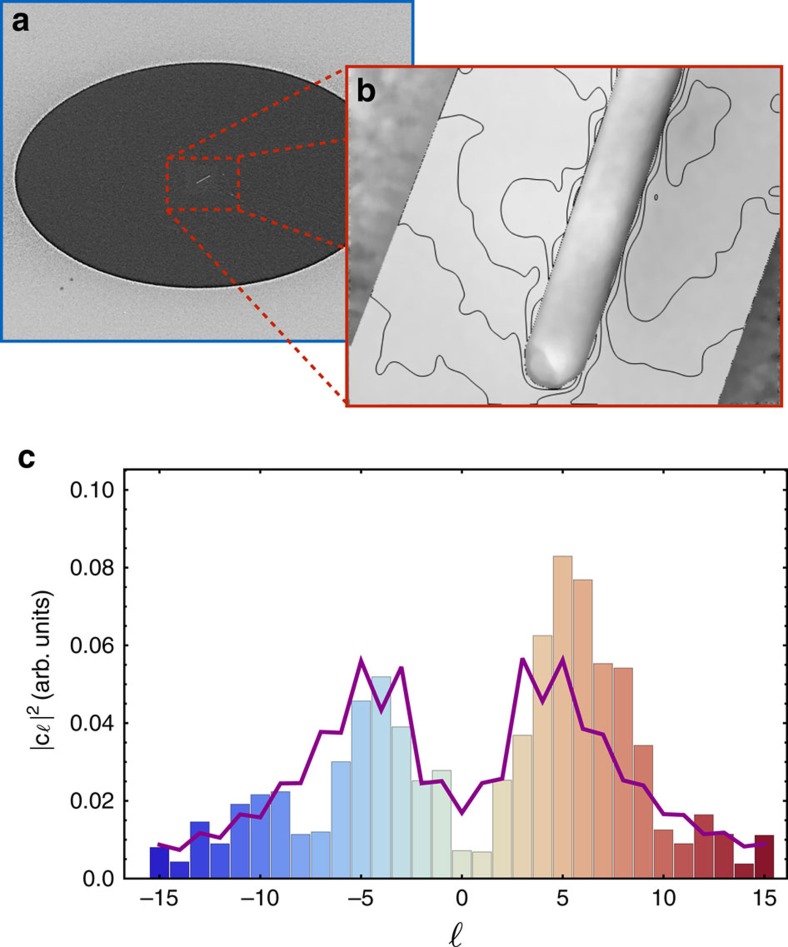
Figure 3. OAM spectrum of a beam affected by a magnetic dipole.
(a) Scanning electron microscopy (SEM) image of the analysed magnetic bar configurated as a dipole. The bar is defined by dimensions of 100 nm (thickness) by 200 nm (width) by 2.8 μm (length). (b) Magnetic field lines of the magnetic bar measured using electron holography. (c) Expected (curve) and obtained (bars) OAM spectrum acquired by the electron beam upon interacting with the magnetic bar. The expected curve was calculated assuming that its magnetic field is saturated. Unlike the measurement performed in (b), the experimental data were obtained while the dipole was exposed to a field in the condenser plane of the electron microscope.

