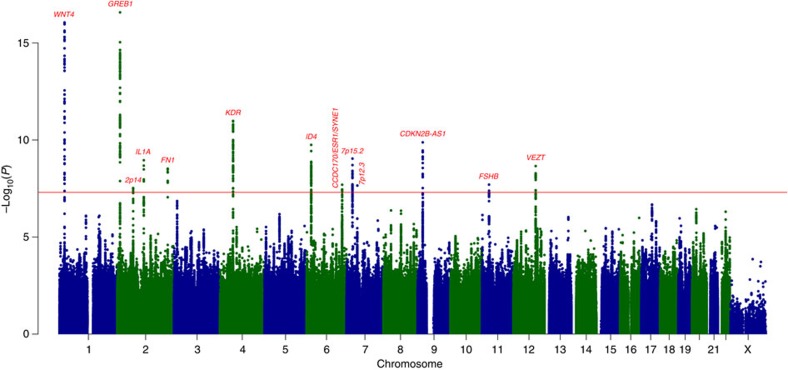
Figure 1. Manhattan plot for genome-wide associations with endometriosis.
Data are based on GWA meta-analysis of all endometriosis cases. The horizontal axis shows the chromosomal position, and the vertical axis shows the significance of tested markers combined in a fixed-effects meta-analysis. Markers that reached genome-wide significance (P<5 × 10⁻⁸) are highlighted.

