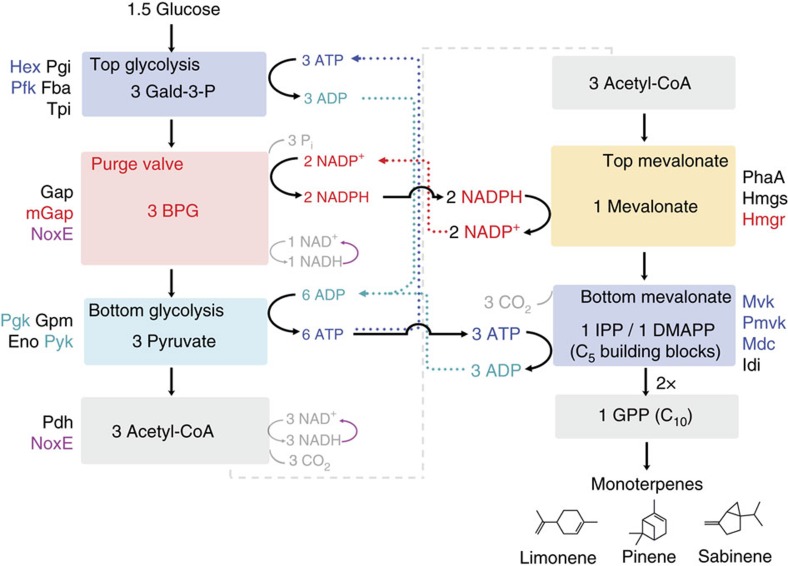
Figure 1. Schematic of the synthetic biochemistry system for conversion of glucose to monoterpenes.
Enzymes in each submodule (coloured boxes) are labelled as described in the text and Supplementary Table 1. ATP-consuming and -generating steps are shown in purple and blue, respectively. The NADPH-generating purge valve is shown in red while the NADPH-consuming top of the mevalonate pathway is shown in orange. Solid arrows show the flow of cofactors and dotted arrows highlight their recycle through respective steps in the pathway.

