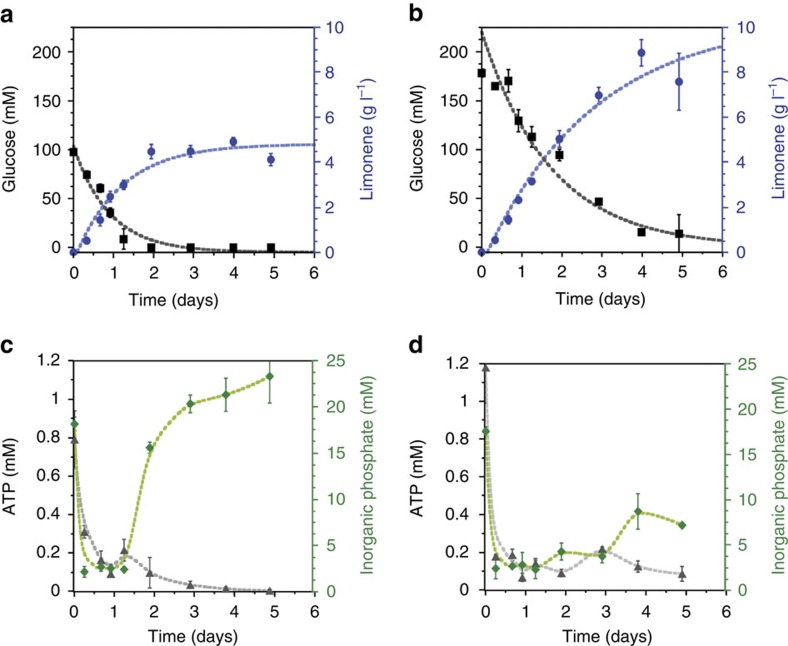
Figure 4. Time course of limonene production from glucose.
Time course of limonene production, glucose consumption, and ATP and Pi levels starting from either 100 (a,c) or 200 mM (b,d) glucose over 5 days. The reaction starting from 200 mM glucose produces twice as much limonene over 5 days compared to starting with 100 mM glucose. Reactions were performed in triplicate (n=3) and analysed as described in the Methods. Error bars represent s.d.

