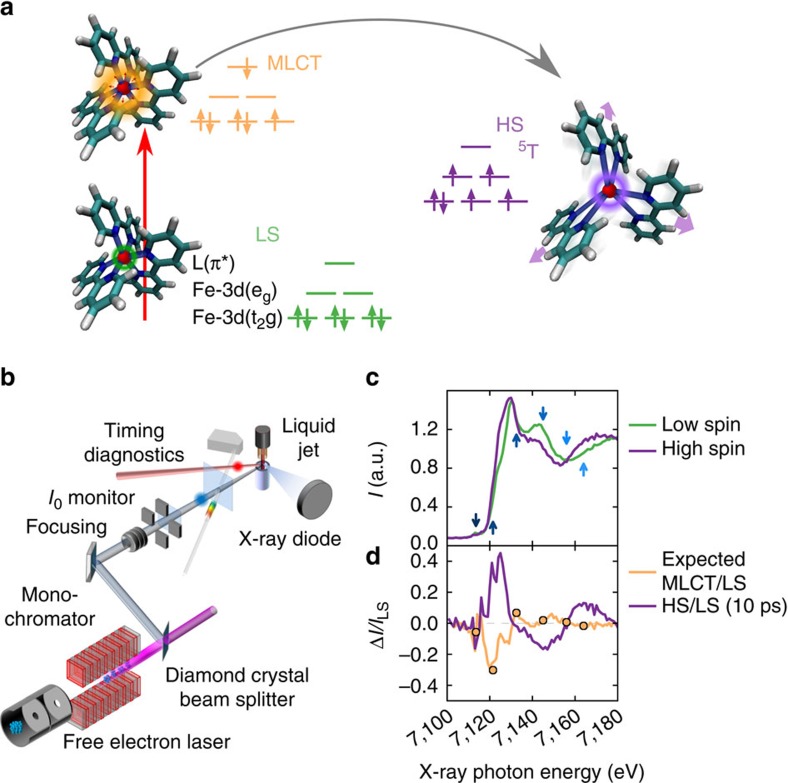
Figure 1. X-ray absorption fingerprints of molecular transformation.
(a) Schematic light-induced excited spin-state trapping for [Fe(bpy)3]2+, where the Fe (red) is bonded to six N (blue) of the bpy ligands (L). After the initial photoexcitation of the LS (t2g6eg0L0) state into an MLCT state (t2g5eg0L1), the system decays towards the HS (t2g4eg2L0) state. (b) Schematic experimental setup with 25(5) fs RMS time resolution. The X-ray beam from a free electron laser is monochromatized by a double diamond (111) crystal and focused to ∼10 μm by means of Beryllium X-ray lenses for probing [Fe(bpy)3]2+ dissolved in water. (c) Changes between the LS and HS XANES spectra. Arrows indicate photon energies for which high time resolution data have been measured. (d) The HS/LS spectra change ratio (magenta line, measured at 10 ps) and the expected ratio between MLCT and LS state (orange solid line) calculated as a +1 eV shift of the MLCT spectrum with respect to the measured LS one. The dots in (d) are the measured MLCT amplitude based on a global fit of the data (see text and Fig. 2). Both curves have been scaled to 100% conversion.

