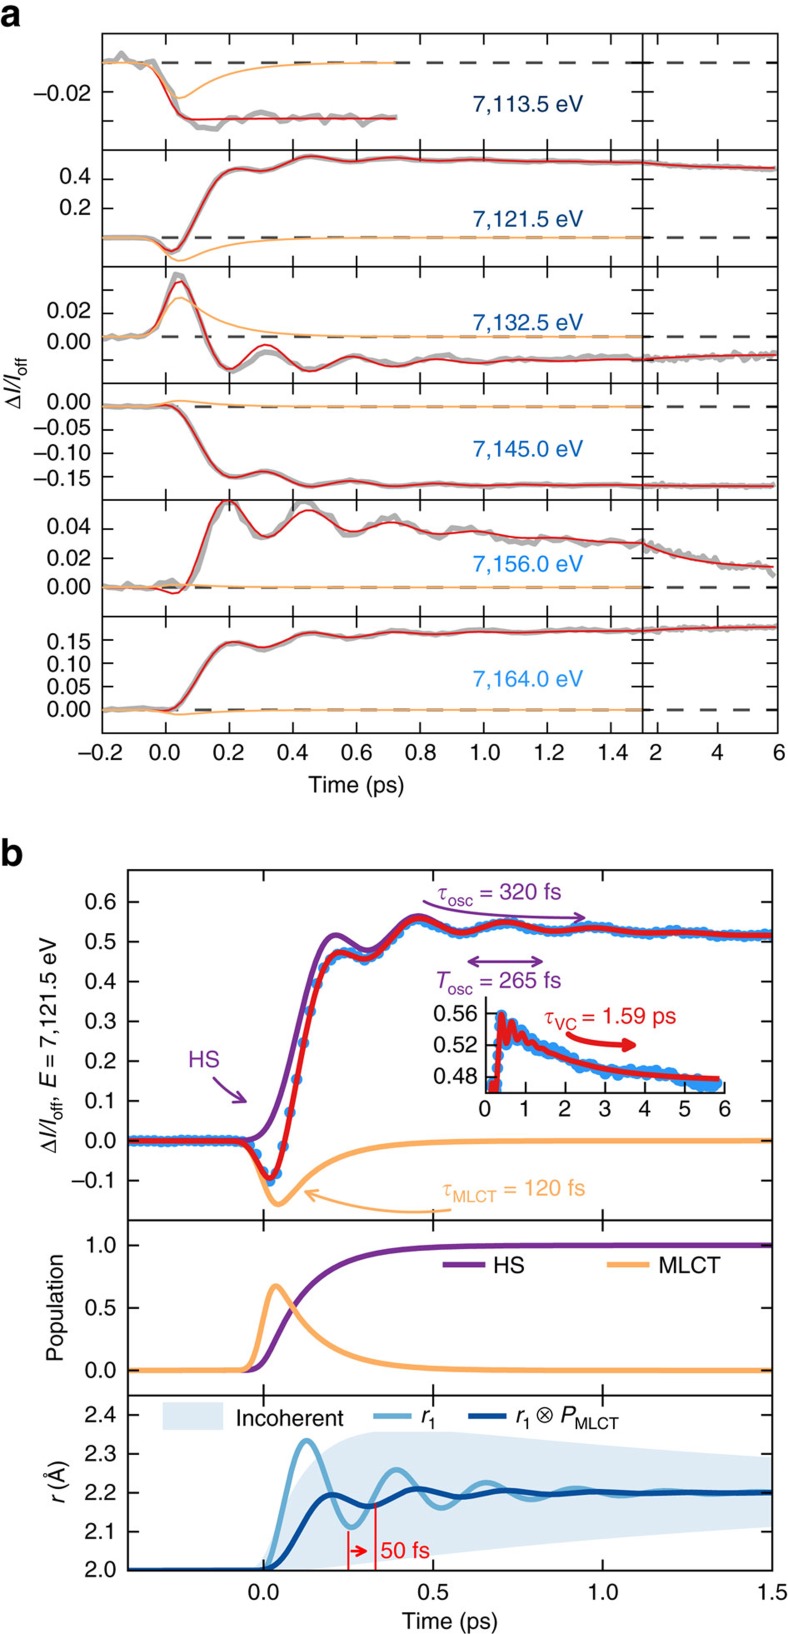
Figure 2. Following dynamics in real time.
(a) Time scans of relative absorption change at selected X-ray energies (solid grey lines) revealing 126(3) cm−1 oscillations (265 fs period). Red lines correspond to the global fit of the entire data set with an empirical model (Supplementary Information). While all amplitude parameters have been varied for every X-ray energy, the dynamic parameters are the same for all energies: MLCT lifetime τMLCT=120(10) fs, oscillation period TOSC=265(10) fs and damping τOSC=320(10) fs and vibrational cooling τVC=1.6(0.1) ps. Orange lines represent the MLCT contributions. (b) Example fit for 7,121.5 eV (top panel), showing the individual contributions of MLCT and oscillating HS contributions along with the total signal. The inset shows the data on a longer time window. The model disentangles the electronic kinetic description (MLCT and HS population, mid panel) from the structural dynamics given by the time evolution of the Fe-N distance r (bottom panel). The exponential growth of the HS population from the MLCT intermediate state leads to an average coherent oscillating trajectory  . This has a reduced amplitude and apparent phase shift (∼50 fs) with respect to a directly initiated damped oscillating trajectory r1(t) in the HS potential. The incoherent part of the molecular oscillations, the transient distribution width in r, decays within 1.6 ps.

