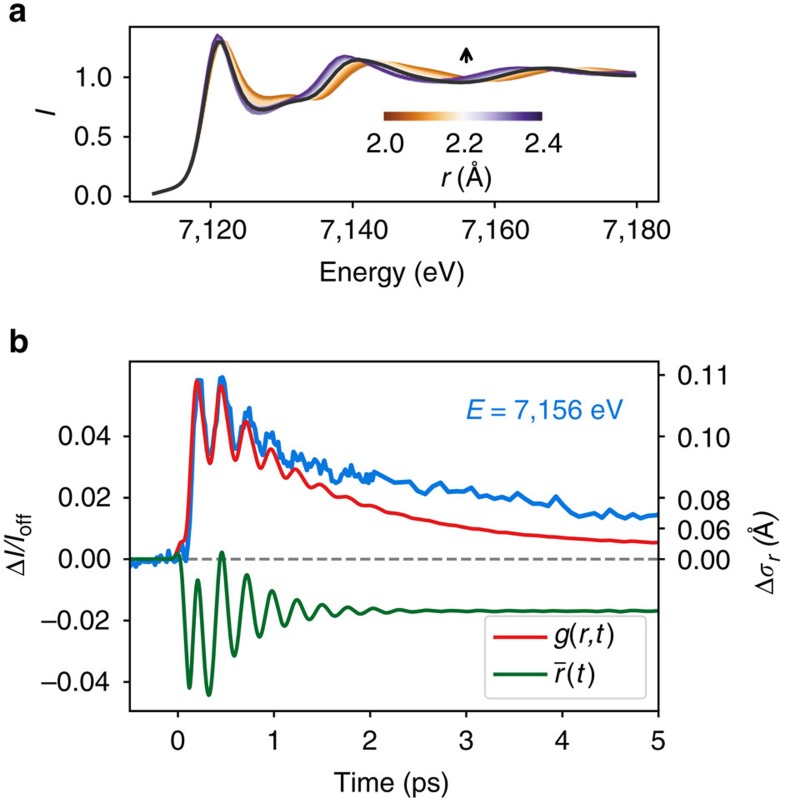
Figure 4. Coherent versus incoherent structural dynamics.
(a) XANES spectra calculated for a variety of Fe-N distances r from 2 Å (blue) to 2.4 Å (gold). (b) experimental data at 7,156 eV (blue), together with calculated signals for the distance distribution g(r, t) (red) of an ensemble motion model (red in Fig. 5c) or its average value r(t) (green). The data are significantly better reproduced by simulations, including the evolving ensemble width distribution. The right y scale represents the calculated width change Δσr of a normal distributed approximation of g(r, t) based on the expansion of the EXAFS equation.

