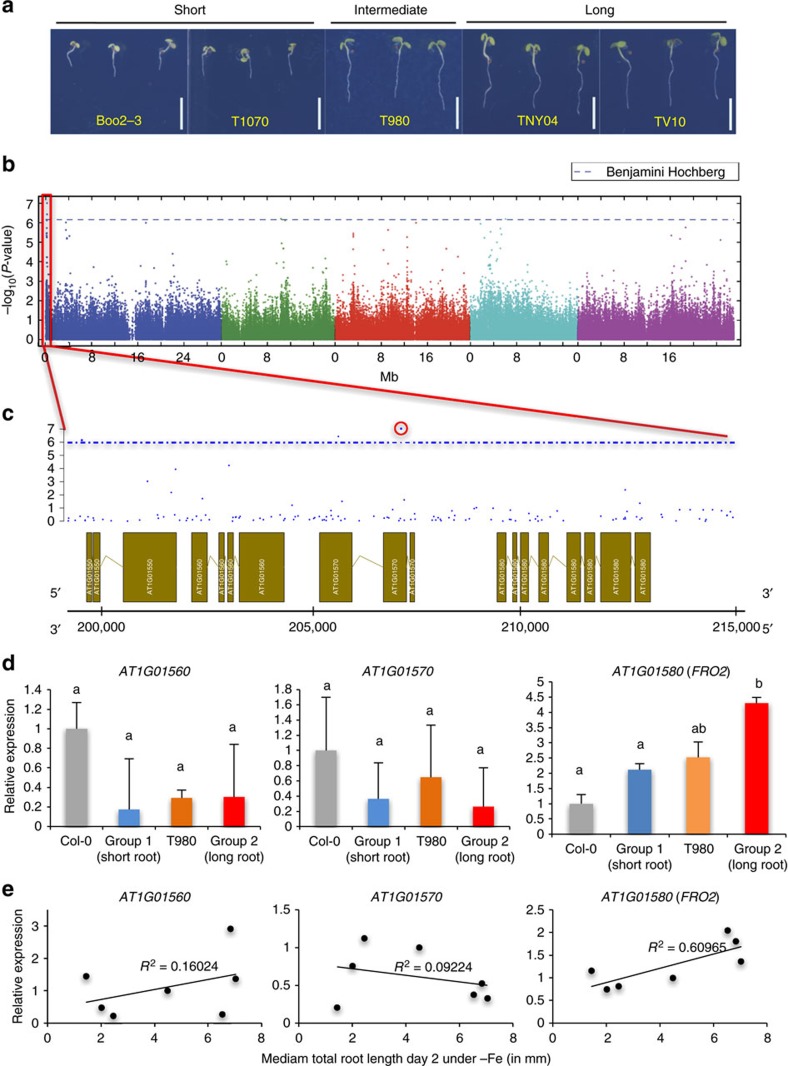
Figure 1. GWAS of root growth under Fe-deficient conditions.
(a) Representative accessions of A. thaliana that show short, intermediate, and long root phenotypes on Fe deficient medium 6 DAG. Scale bars, 1 mm. (b) Manhattan plot for the SNP associations to median root length on day 2. Analysis performed on GWAPP42. Chromosomes are depicted in different colours. The horizontal blue dash-dot line corresponds to a nominal 0.05 significance threshold after Benjamini Hochberg (False Discovery Rate) correction. Red box indicates the region containing the significantly associated locus. (c) The genomic region surrounding the significant GWA peak. Top, −log10 P-values of association of the SNPs. Bottom, gene models in genomic regions. The x-axis represents the position on chromosome 1. (d) Gene expression of AT1G01560, AT1G01570, and FRO2 in accessions displaying extreme root lengths (Group 1: Boo2–3, T1070, and Grön 14, short; T980, intermediate; and Group 2: TNY 04, TDr-16 and TV-10, long) as measured by qRT-PCR. Expression levels were normalized to expression in Col-0. Error bars: s.e.m. For qRT-PCR analyses, seeds were evenly placed on the mesh in a single row at a density of ∼20 seeds per cm in two rows. Whole roots were sliced off and collected in liquid nitrogen. Around 50 plants were pooled together; data from three independent biological replicates each with two technical replicates are expressed as s.e.m. The letters a and b indicate significant differences between mRNA expression levels (determined by one-way ANOVA and Tukey HSD (P<0.05, n=3) (e) Scatter plots of gene expression (y-axis) and total root length (x-axis) in accessions displaying extreme short (Boo2-3, T1070, and Grön 14), intermediate (T980) and long root lengths (TNY 04, TV-10, and TDr-16). The lines represent the result of linear regression. R2: coefficient of determination of the linear regression.

