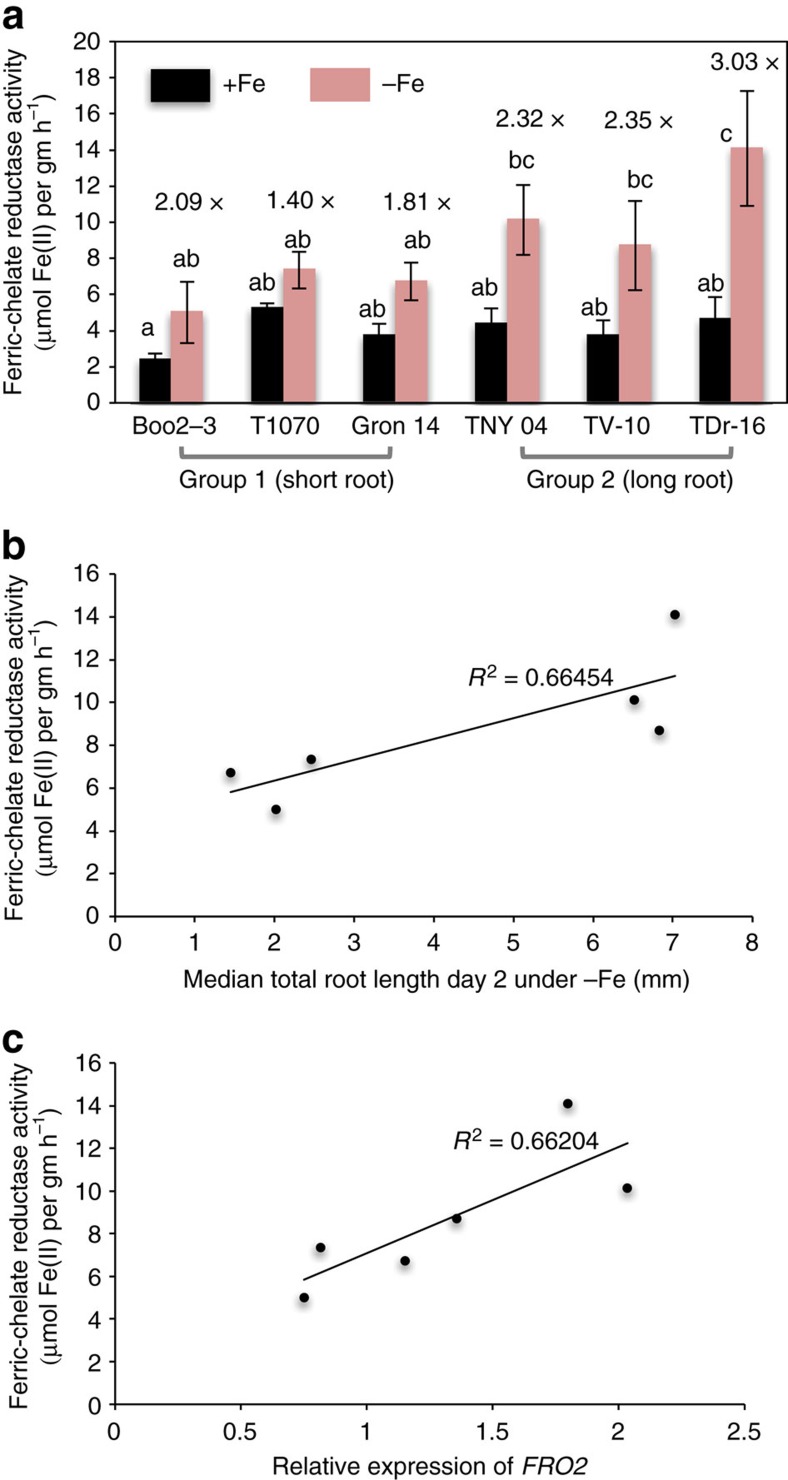
Figure 2. Assays of ferric chelate reductase activity in extreme accessions.
(a) Assays of ferric chelate reductase activity in accessions with short roots (Group 1: Boo2-3, T1070, and Grön 14) and accessions with long roots (Group 2: TNY 04, TV-10, and TDr-16). Plants were grown on standard medium for 14 days and then transferred to either iron-deficient (red bars) or -sufficient (blue bars) medium for 3 days before the assay. Around 10 plants were pooled together; data from three independent biological replicates each with two technical replicates are expressed as s.e.m. The letters a and b indicate significant differences (determined by one-way ANOVA and Tukey HSD (P<0.05, n=3). (b) Scatter plots of ferric chelate reductase activity (y-axis) and total root length (x-axis) and (c) FRO2 transcript levels (x-axis) in accessions displaying extreme short (Boo2-3, T1070, and Grön 14) and long root lengths (TNY 04, TV-10, and TDr-16). The lines represent the result of linear regression. R2: coefficient of determination of the linear regression.

