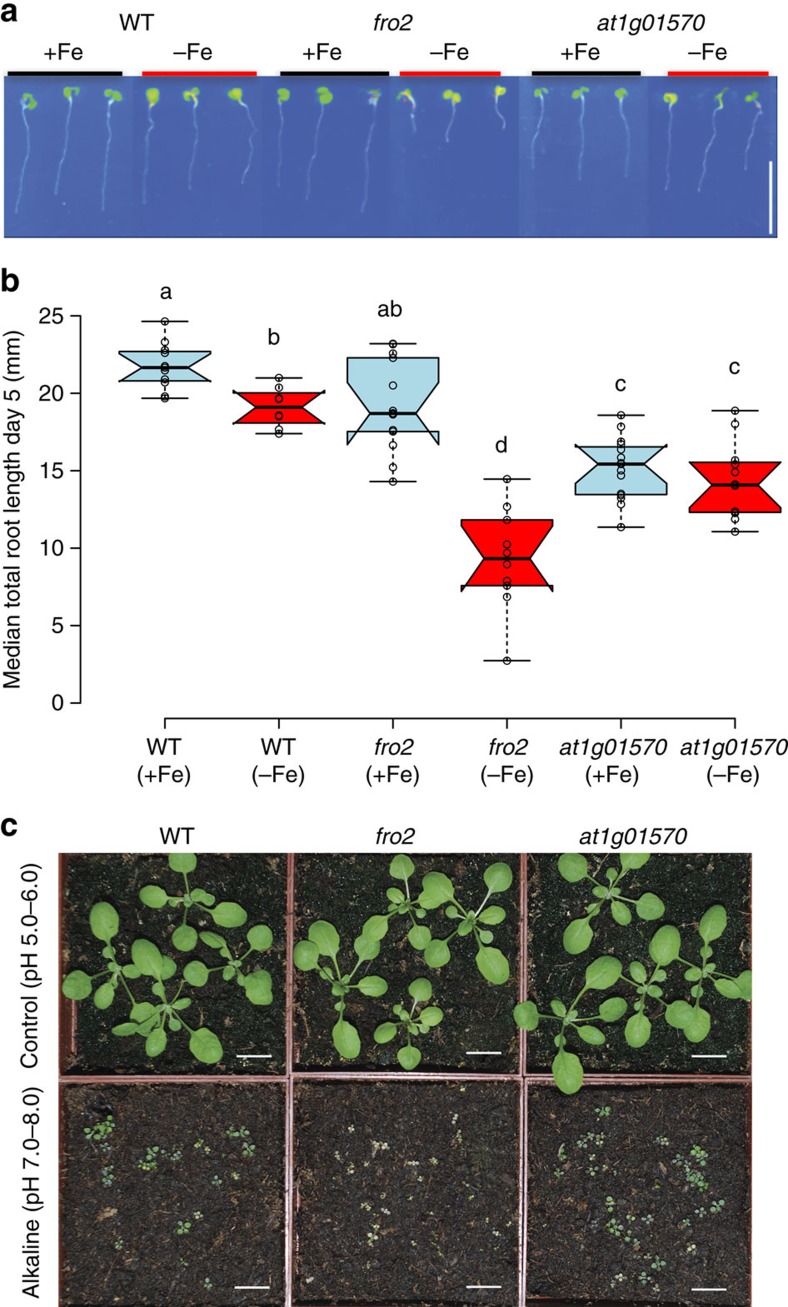
Figure 3. FRO2 regulates root growth under Fe deficiency.
(a) Representative seedlings of wild-type (Columbia Col-0), fro2 mutants, and at1g01570 at 6 DAG grown on Fe sufficient (1 × MS) or Fe-free medium. Scale bars, 1 mm. (b) Boxplot of total root length of WT, fro2 and at1g01570. Horizontal lines show the medians; box limits indicate the 25th and 75th percentiles; whiskers extend to 5th and 95th percentiles. Letters a, b, c and d indicate significantly different values at P<0.05 determined by one-way ANOVA and Tukey HSD. (c) Plant vigor of WT, fro2, and at1g01570 on normal soil pH (5.0–6.0) and alkaline pH (7.0–8.0; low Fe availability) Plants were grown on normal or alkaline soil for two weeks. White scale bars, 10 mm.

