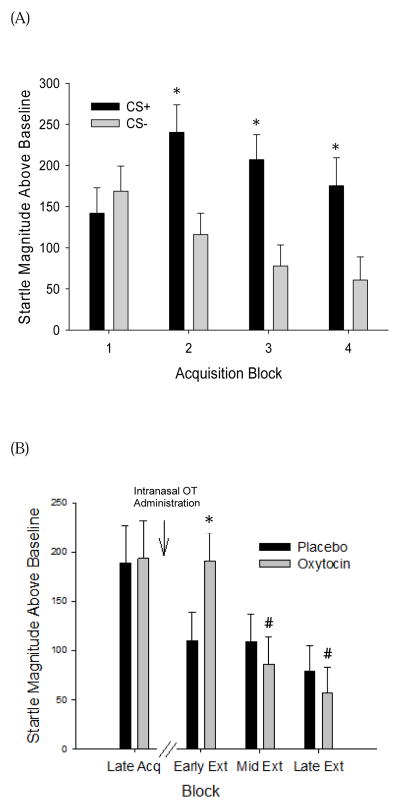
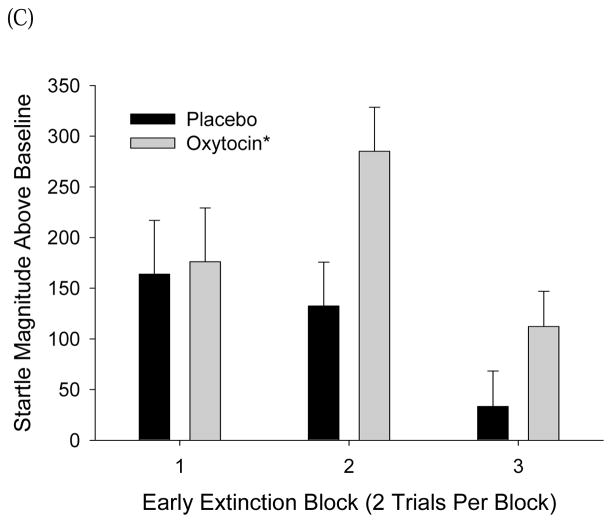
Figure 2.
(A) Potentiated startle magnitudes for the Acquisition Phase before treatment. *p < .05 vs. CS−. (B) Potentiated startle magnitude to the CS+ during Late Acquisition and Early, Mid and Late Extinction phase by Treatment Group. *p < .05 vs. placebo. # p < .05 vs. Early Extinction phase responding within group. (C) Potentiated startle magnitudes to the CS+ during Early extinction depicted in two-trial blocks. *p<0.05, main effect of oxytocin. Data are depicted as mean±SEM difference scores in peak startle magnitude during CS+ or CS− trials compared to noise alone trials.


