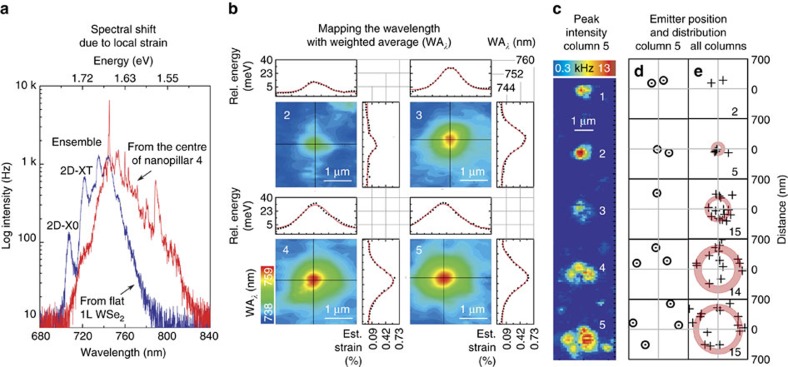
Figure 5. Positioning accuracy determined by weighted spectral averaging.
(a) Typical PL spectra from the bi-axially strained WSe2 monolayer at the centre of a nanopillar (red spectrum) and an unstrained region (blue spectrum). 2D-X0 (2D-XT) refers to the non-localized neutral (charged) exciton state. (b) The colour-coded spatial maps of weighted average wavelength (WAλ) for pillars 2–5 from c. The nanopillar centre positions are determined by fitting Gaussian to the WAλ profile, shown by the cross-sections. (c) The high-resolution colour-coded PL spatial map of peak intensity from column 5. The individual emitters are resolved and can be compared against the WAλ mapping. (d) Positions of single emitters (black circles) relative to the centre of the nanopillars (grey crosses) for each row from column 5. (e) Positions of all emitters (black crosses) in columns 2–5. The red rings represent the average emitter displacement and the ring thickness represents the standard deviation. The number of emitters mapped is identified in the lower right corner of each emitter location map.

