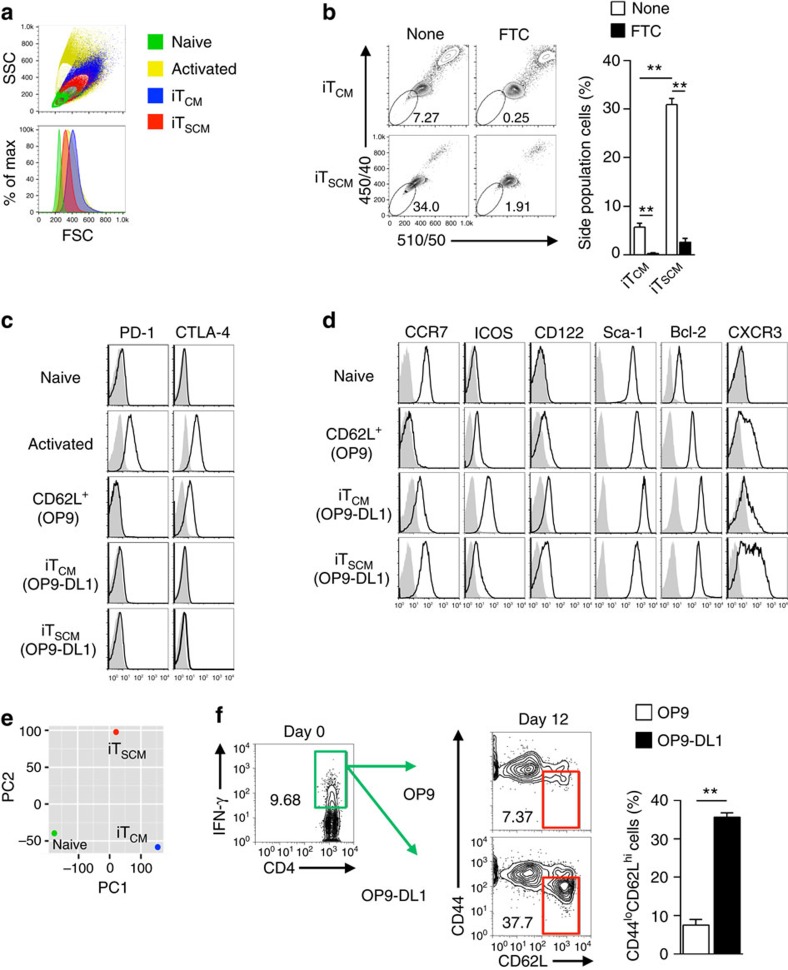
Figure 2. Characterization of CD4+ iTSCM cells.
(a) Flow cytometry analysis for cell sizes. Cell sizes are evaluated as relative values of forward scatter (FSC). Representative data of 3 independent experiments are shown. (b) SP assays were performed as described in the Methods section. Representative dot plots (left). The bar graphs show the percentages of SP cells (n=3) (right). (c,d) Flow cytometry analysis for the expression of surface markers and intracellular Bcl-2 in naive CD4+ T, CD62L+ CD4+ T, CD4+ iTCM and CD4+ iTSCM cells. (e) Principal component analysis of naive CD4+ T, CD4+ iTCM, and CD4+ naive-like T cells (iTSCM). (f) Induction of CD4+ iTSCM cells from in vivo-primed Th1 cells by coculturing with OP9 or OP9-DL1 cells. CD4+ T cells isolated from immunized CD45.2+ OT-II IfngVenus mice were transferred into CD45.1+ congenic mice, followed by immunization with OVA/CFA. Six days later, CD45.2+IFN-γ+CD44hiCD4+ T cells (green square) were purified, and then cocultured with OP9-DL1 cells for 12 days. The iTSCM-like gate is indicated by the red square (n=3 per each groups). **P<0.01 (Student's t-test). Data are representative of two independent experiments (a–d,f) and microarray data are acquired by single experiment (e). Error bars show s.e.m.

