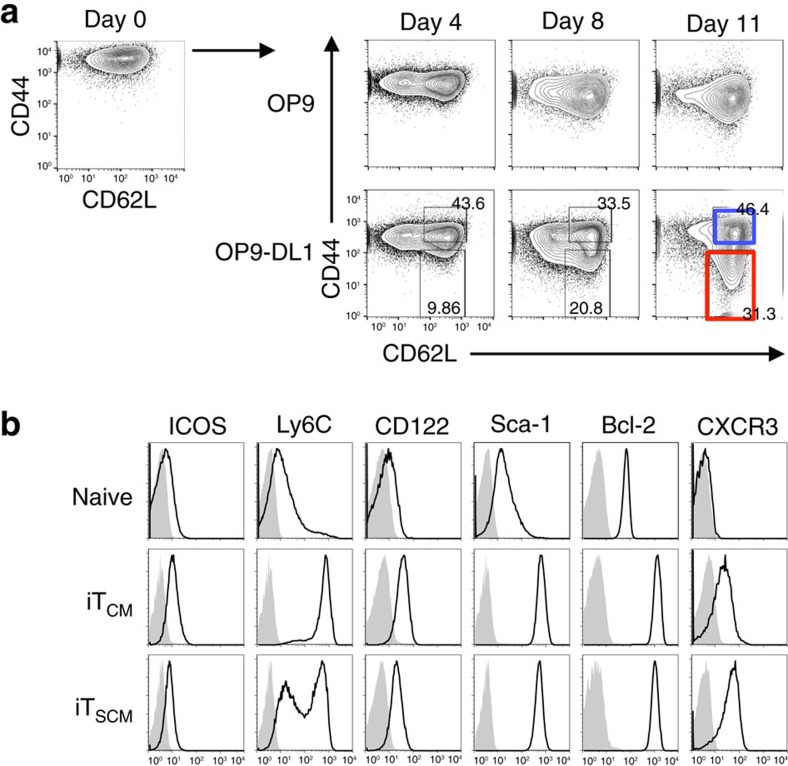
Figure 3. Induction of CD8+ iTSCM cells via Notch signalling.
(a) CD44 and CD62L expression on OT-I CD8+ T cells at each time point during the coculture with OP9 (upper) or OP9-DL1 (lower) cells. CD8+ iTCM and iTSCM cells are indicated by blue and red squares, respectively. (b) Flow cytometry analysis for the expression of surface markers and intracellular Bcl-2 in naive CD8+ T, CD8+ iTCM and CD8+ iTSCM cells. Representative data of three independent experiments are shown in (a) and (b).

