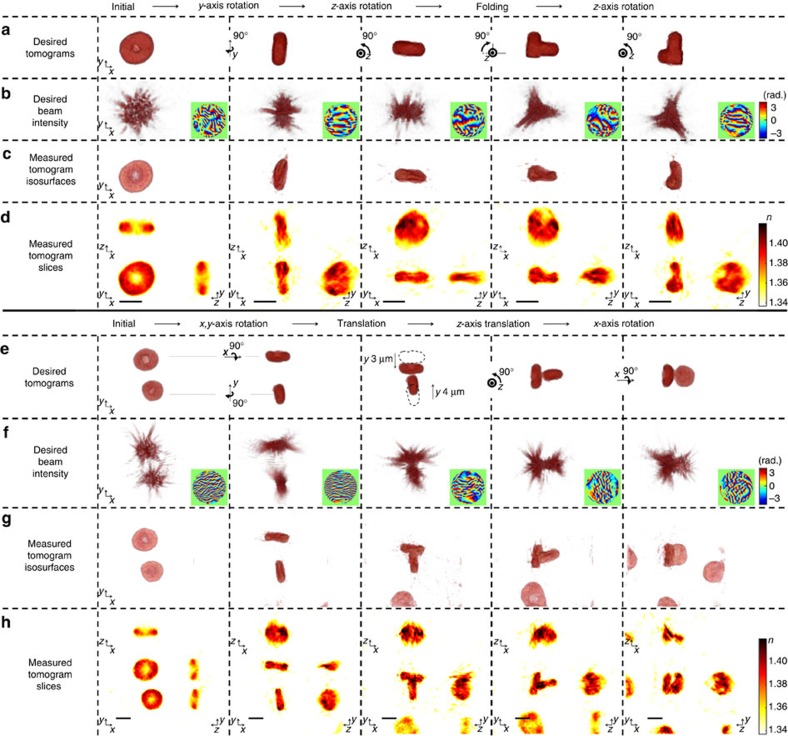
Figure 4. Controlling the orientation, shape and assembly of red blood cells.
(a–d) Time-lapse images of orientation control of individual red blood cells (RBCs) shown in Supplementary Movie 3. (e–h) Time-lapse images of the assembly of two RBCs shown in Supplementary Movie 4. See also Supplementary Fig. 2 for presenting full sequences of optical manipulation of a RBC and the assembly of RBCs. (a,e) Desired tomograms calculated by applying rotational, translational, and/or folding transformations to the reconstructed tomogram of the initial state. (b,f) Desired 3D beam intensity generated by numerical propagation of the phase-only hologram in the insets of each column. The phase-only holograms were calculated by applying the 3D Gerchberg-Saxton algorithm to the desired tomograms in each column in a,e, respectively. (c,g) 3D rendered isosurfaces of the tomograms of RBCs trapped by the desired 3D beam intensity distribution in each column of b,f, respectively. (d,h) The cross-sectional slice images of the measured tomograms in the x–y, x–z, and y–z planes. Scale bar indicates 5 μm.

