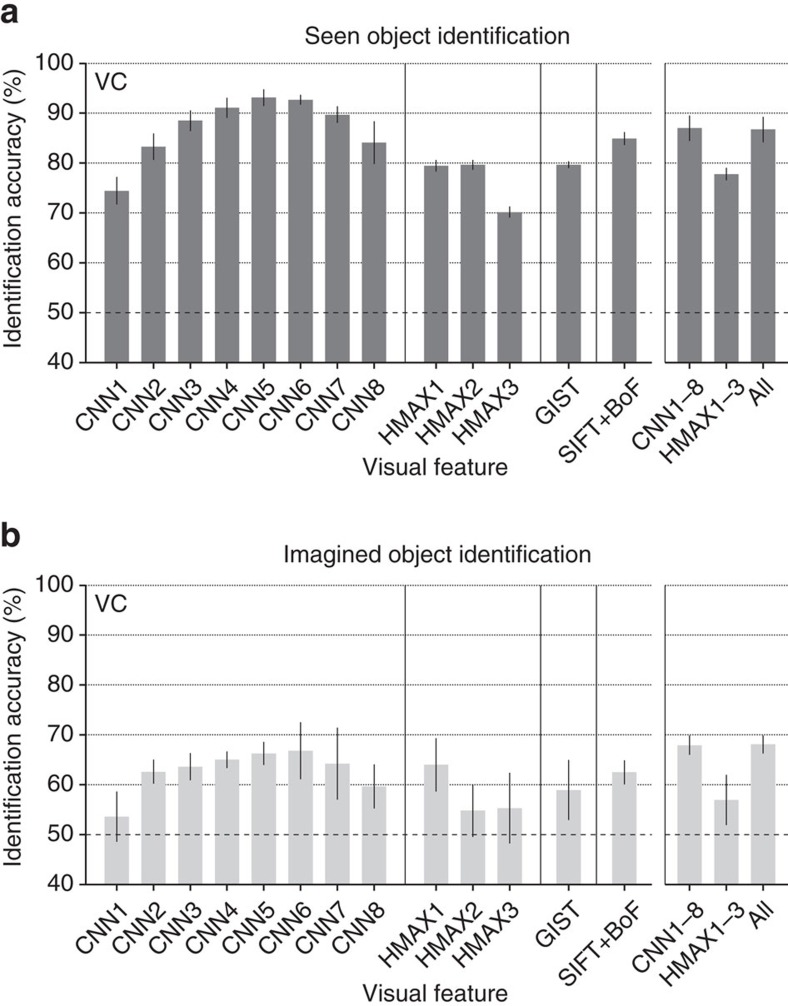
Figure 10. Identification accuracy.
Identification was performed for all combinations of 1 of the 50 test object categories and 1 of the 15,322 candidate categories (identification from two categories; predicted from VC: error bars, 95% CI across five subjects; dashed line, chance level, 50%). (a) Seen object identification accuracy. (b) Imagined object identification accuracy. While the identification analyses here were performed with the image feature decoders trained to predict image features of presented images, it is also possible to use category-average feature decoders trained with category-average features for training stimulus images. See Supplementary Figs 12 and 13 for the results of the category-average feature decoders.

