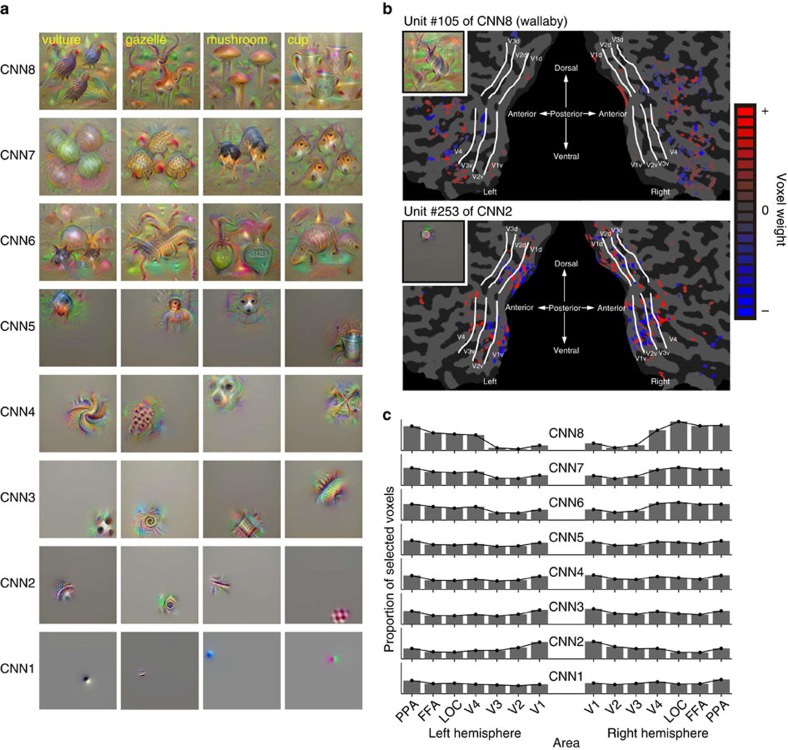
Figure 4. Preferred images and weight distributions for CNN layers.
(a) Examples of preferred images for individual units (four randomly selected units) in each CNN layer. Because each unit of CNN8 corresponds to a specific category, the names of the categories for each unit are shown at the top left. (b) Voxel weight maps on the flattened cortical surface. Weights resulting from the decoders trained to predict feature values of a single feature unit are shown for Unit #105 of CNN8 and for Unit #253 of CNN2 (predicted from VC, Subject 3). The preferred image for each unit is indicated in the inset. (c) Distributions of selected voxels across individual subareas for CNN layers. Distributions of selected voxels used for prediction are shown for each CNN layer (predicted from VC, averaged across five subjects). The proportion of selected voxels for each subarea was calculated by first counting the numbers of selected voxels for individual feature units, aggregating them over ∼1,000 feature units in each layer, and then normalizing with the total voxels.

