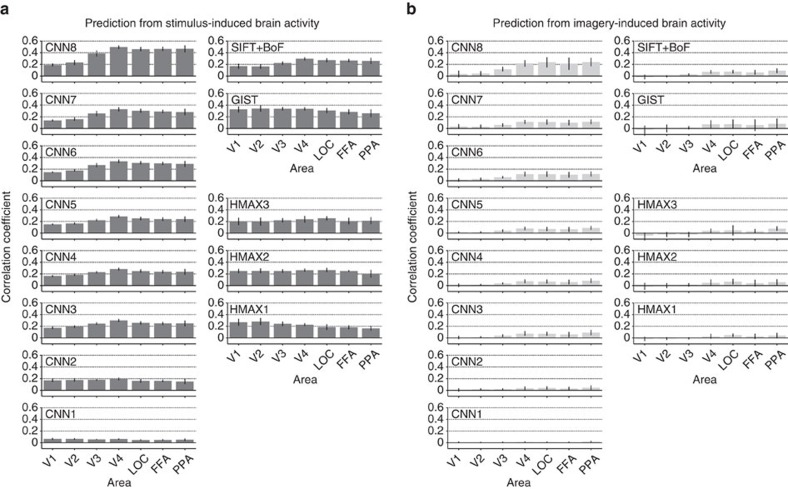
Figure 6. Prediction of category-average features from stimulus- and imagery-induced brain activity.
(a) Correlation coefficients with predicted features from stimulus-induced brain activity. (b) Correlation coefficients with predicted features from imagery-induced brain activity. Mean correlation coefficients are shown for each feature type/layer and ROI (error bars, 95% CI across five subjects). See Supplementary Fig. 6 for the relation between category discriminability and prediction accuracy (cf., Fig. 5c). Similar analyses can be performed using the decoders trained with category-average features (not image features) for training stimulus images (category-average feature decoders), showing qualitatively similar prediction results with higher accuracy for imagery-induced brain activity (Supplementary Figs 7 and 8b).

