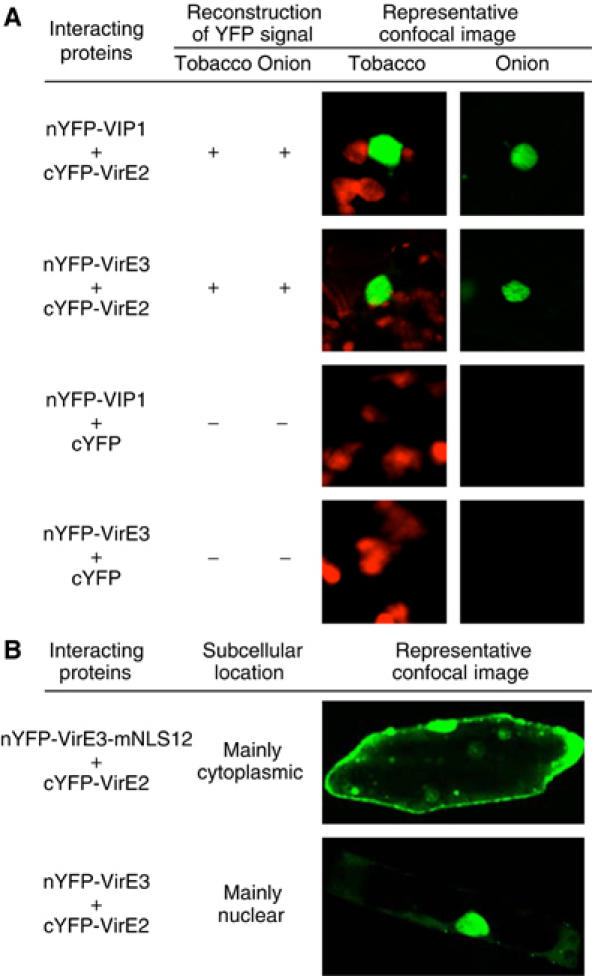
Figure 5.

BiFC assay for the VirE3–VirE2 interaction in planta. Positive reconstruction of YFP fluorescence indicates that the signal was observed in numerous (30–100) cells per each bombardment. Negative reconstruction of YFP fluorescence indicates that the signal was never found in any bombarded cells. Representative confocal images of bombarded cells observed in each experimental system are shown. YFP is in green, and plastid autofluorescence is in red. Note that onion cells do not contain chloroplasts. (A) Images focus on tobacco and onion cell areas with reconstructed YFP signal. (B) Images show entire onion cells. All images are single confocal sections.
