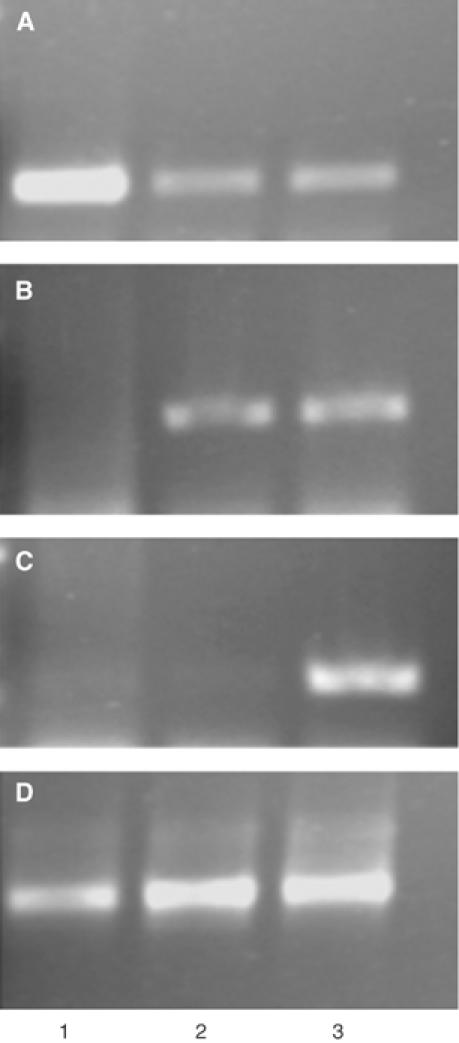
Figure 7.

Quantitative RT–PCR analysis of VIP1 antisense/VirE3 double-transgenic plants. (A) Detection of sense VIP1 RNA-specific product (290 bp). Lanes 1–3, wild-type plants, VIP1 antisense plants, and VIP1 antisense/VirE3 double-transgenic plants, respectively. (B) Detection of antisense VIP1 RNA-specific product (290 bp) in the samples shown in panel A. (C) Detection of sense VirE3 RNA-specific product (210 bp) in the same samples shown in panel A. (D) Detection of sense actin RNA-specific product (500 bp) in the samples shown in panel A.
