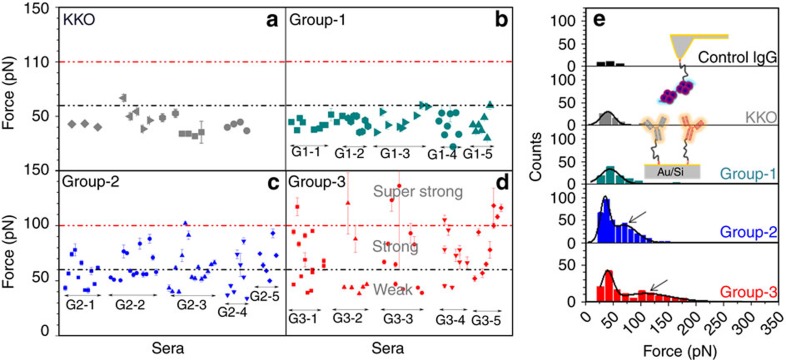
Figure 4. Differences in binding characteristics of single antibodies.
To each cantilever, a different antibody purified from the same serum was attached (five sera per group). Each dot shows the mean and s.e. of the rupture forces for each respective antibody. (a) KKO and (b) group-1 ABS bind to PF4/H complexes with a binding strength mostly lower than 60 pN (black dotted line), while (c) group-2 and (d) group-3 ABS consist of ABS with different binding forces. A subset of group-3 ABS binds to PF4/H complexes with rupture forces higher than 100 pN (red dotted line). (e) Reverse experimental design: a PF4/H complex was immobilized on the tip, while antibodies were immobilized on the substrate (inset). The force histogram for control IgG (black) was used to determine the background. KKO (grey) and group-1 ABS (dark cyan) showed only one force distribution, while two distributions were observed for group-2 (blue) and group-3 (red) ABS. The second force distribution of group-3 ABS shifted to a higher force regime as compared to group-2 ABS (arrows).

