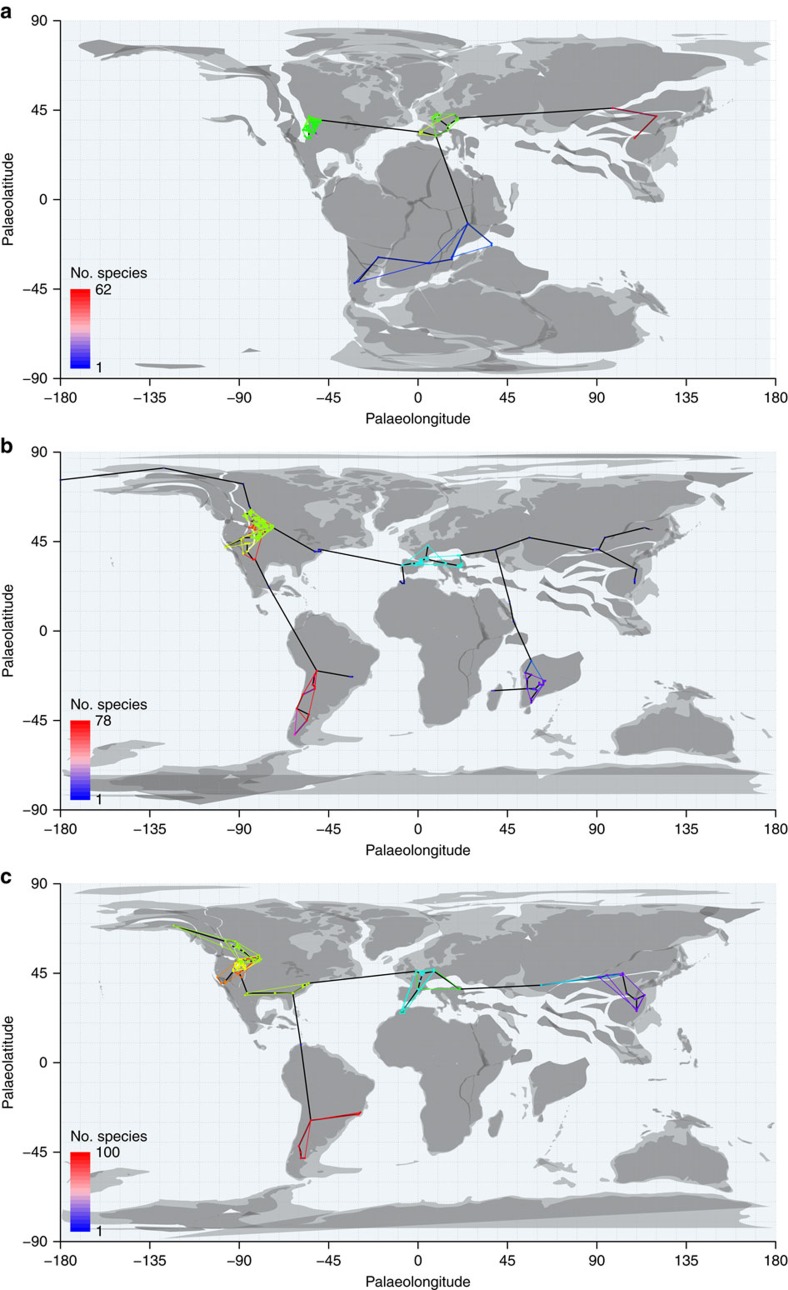
Figure 1. Palaeomaps of fossil occurrences through time.
Global MST shown in black and equal-area spatial subsamples enclosed by coloured convex hulls. Fossil occurrences are binned into 1° grid cells. Heatmap colours of nodes falling outside equal-area subsamples indicate number of species known from each grid cell, to demonstrate that subsamples do not omit exceptionally diverse localities. (a) J6=Kimmeridgian, Tithonian (Late Jurassic); (b) K8=Maastrichtian (Late Cretaceous); (c) Pg1=Selandian, Thanetian (early Palaeogene). Palaeomaps drawn using shapefiles from the Scotese PALEOMAP project80.

