
Figure 1.
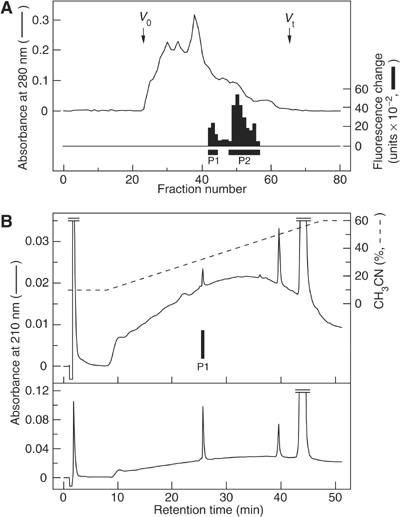
Purification of NMS. (A) Gel filtration on a Sephadex G-50 (fine) column of the SP-III fraction from 510 g of rat brain. Black bars indicate fluorescence change due to [Ca2+]i increase in CHO/FM-4. Active fractions containing NMS (P1) and NMU (P2) are indicated. V0, void volume; Vt, total volume. (B) Chromatographic comparison using RP-HPLC of natural NMS (upper panel) and synthetic NMS (lower panel). The black bar indicates [Ca2+]i -increasing activity (upper panel). Each peptide was applied to a Chemcosorb 3ODS-H column. The flow rate was 0.2 ml/min. Solvent system, a linear gradient elution from (A) to (B) for 40 min. H2O:CH3CN:10% TFA for (A) was 90:10:1, for (B) 40:60:1 (v/v).