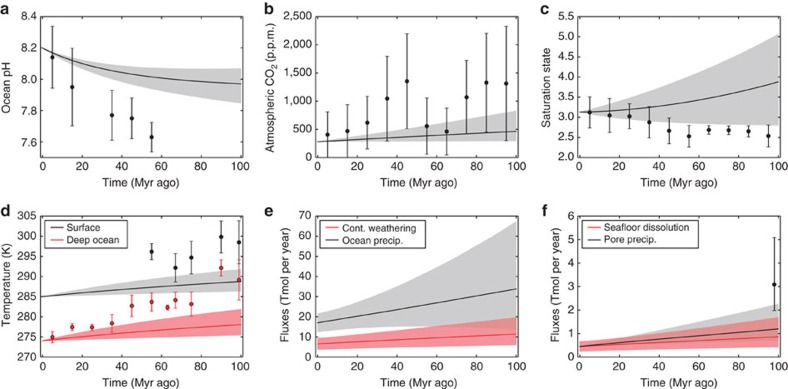
Figure 2. Carbon cycle model with poor fit to data assuming conventional temperature dependence of continental weathering and no weatherability change.
Selected model outputs and geochemical proxy data for a conventional temperature sensitivity range for continental weathering (Te=5–15 K), and no change in silicate weatherability over the last 100 Myr ago (W=0). Grey- and red-shaded regions represent the model output 90% confidence obtained from 10,000 forward model runs using the parameter ranges described in Table 1. The grey- and red-solid lines are the median model outputs. Black and red dots represent binned geochemical proxy data, and error bars denote the range of binned proxy estimates (see main text for references and explanation). Panels denote (a) ocean pH, (b) atmospheric pCO2, (c) ocean saturation state, (d) mean surface and deep ocean temperatures, (e) continental silicate weathering and ocean carbonate precipitation fluxes, and (f) seafloor dissolution and pore space carbonate precipitation fluxes. This case is a very poor fit to temperature and pH, and is a relatively poor fit to ocean saturation state and seafloor carbonate precipitation.

