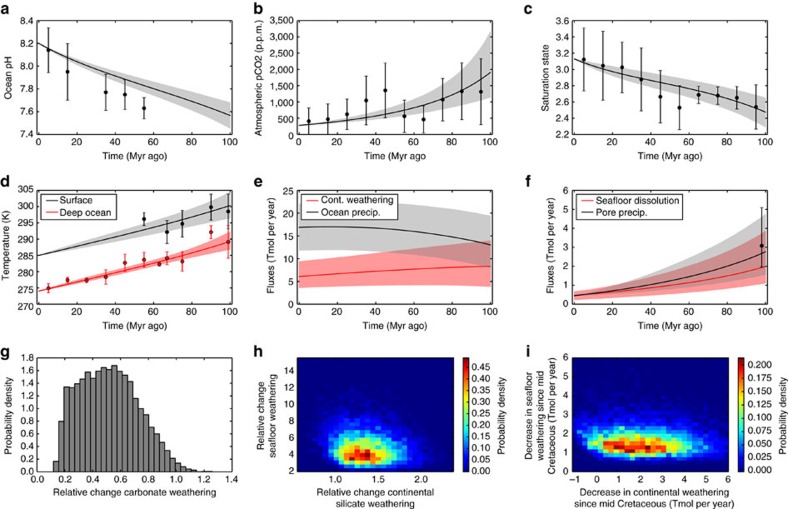
Figure 5. Carbon cycle model fitted to data with Bayesian inverse analysis.
Bayesian Markov Chain Monte Carlo (MCMC) results for the nominal model. (a–f) Grey- and red-shaded areas show 95% credible intervals for selected model outputs, and solid lines show median model outputs. Black and red circles are geochemical proxies, and error bars denote the range of binned proxy estimates (see main text). Note that the credible intervals encompass the Cretaceous proxies (within uncertainty) in almost all cases. (g–i) Probability distributions for the relative and absolute change in seafloor dissolution, continental silicate weathering and continental carbonate weathering. Relative changes refer to flux at 100 Myr ago relative to the modern flux.

