
Figure 2. DNA content analysis in MRC5 cells irradiated with 10 Gy.
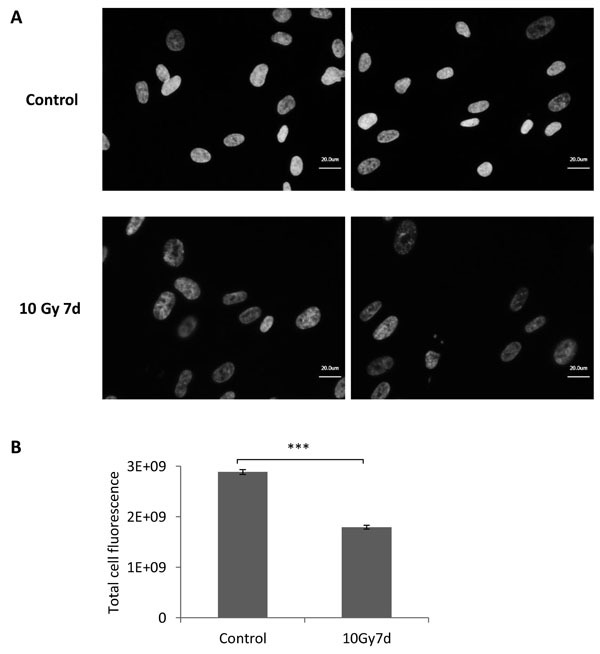
A. Representative pictures of DAPI stained control and irradiated MRC5 fibroblasts. Cells were analysed seven days after irradiation with 10 Gy. B. Bar graph depicting comparison of DAPI signal intensity in control and irradiated cells. The expression was quantified as a total cell fluorescence (mean ± SEM (n ≥ 3), cell counts > 350 cells); ***: P < 0.001, unpaired two-sided t-test.