
Figure 5. Endo G expression analysis in MRC5 cells seven days after irradiation with 10 Gy.
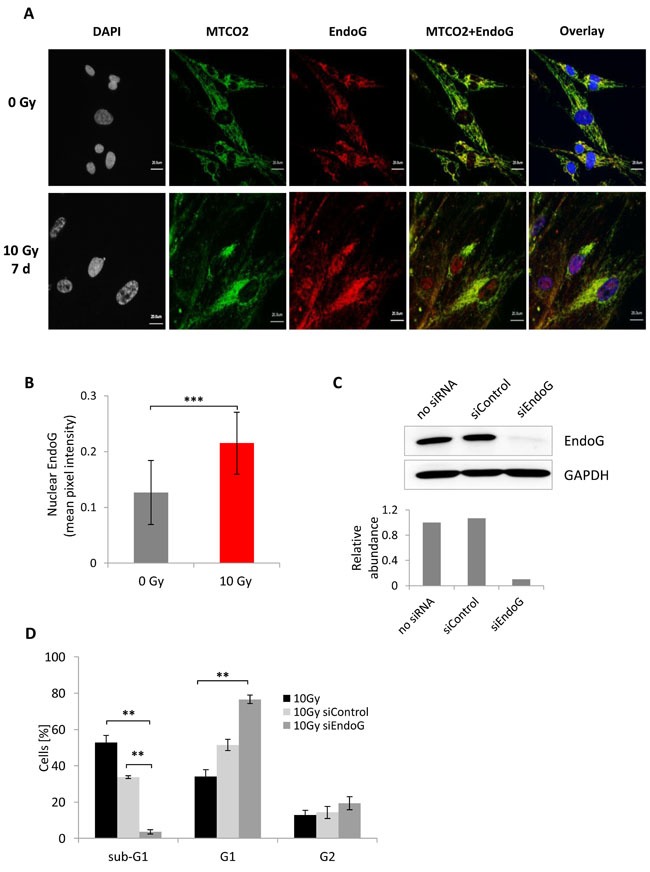
A. Immunofluorescence staining of mitochondria -MTCO2 (green) and EndoG (red) in control and irradiated cells. B. Bar graph depicting comparison of the nuclear EndoG fluorescence intensity in control and irradiated cells. The expression was quantified as mean pixel intensity (mean ± SEM (n ≥ 3)); ***: P < 0.001, unpaired two-sided t-test. C. Immunoblot depicting EndoG knockdown efficiency in MRC5 cells. Knockdown was verified 48 hours after transfection. Lower panel: quantification of the EndoG abundance in MRC5 cells after knockdown. D. Bar graph showing distribution of irradiated cells transfected either with control siRNA or EndoG siRNA within the sub-G1, G1, and G2+M phases (mean ± SEM (n = 3)); **: P < 0.01, unpaired two-sided t-test.