
Figure 6. γH2AX foci number in irradiated MRC5 cells with EndoG depletion.
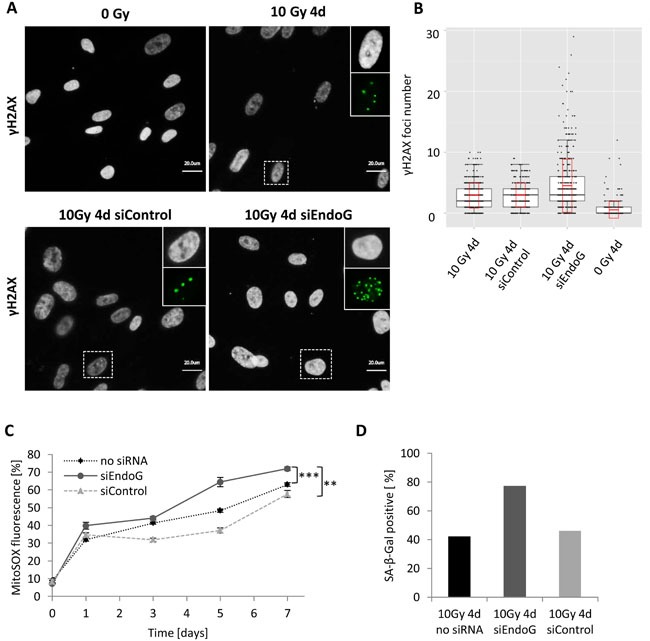
A. Immunofluorescence staining of γH2AX foci (green) four days after irradiation- control and irradiated (10 Gy) MRC5 cells transiently transfected either with control siRNA (siControl) or EndoG siRNA (siEndoG). The boxed areas are shown as insert images at higher magnification at the right. b. Quantification of γH2AX foci in control and irradiated (10 Gy) MRC5 cells (box plots for three independent experiments with cell counts > 100 cells each, black boxes, black horizontal line and whiskers indicate 25%-75% quartiles, median and 1.5*interquartile range, respectively, red boxes and red horizontal line indicate standard deviation and mean, respectively). C. MitoSOX fluorescence measured in MRC5 cells at indicated time points after 10 Gy irradiation (mean ± SEM (n ≥ 3)); ***: P < 0.001,**: P < 0.01, unpaired two-sided t-test. D. Bar graph depicting differences in SA-β-Gal activity four days after irradiation between non-transfected MRC5 and cells transfected either with control siRNA (siControl) or EndoG siRNA (siEndoG).