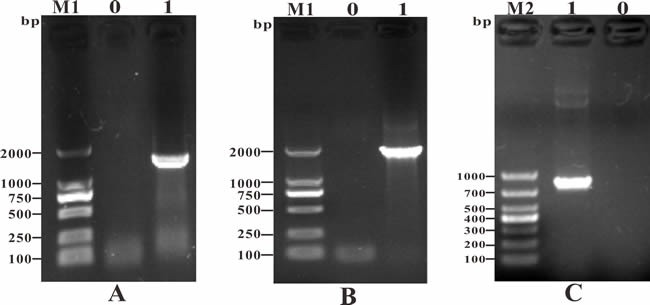
Figure 1. PCR amplification of candidate antigen genes.

A. M1: DNA Marker (DL2000); Lane 0: negative control; Lane 1: PCR product of the Srr gene (1320 bp); B. M1: DNA Marker (DL2000); Lane 0: negative control; Lane 1: PCR product of the NeuA gene (1833 bp); C. M2: DNA Marker (DL1000); Lane 0: negative control; Lane 1: PCR product of the Hsp gene (867 bp).
