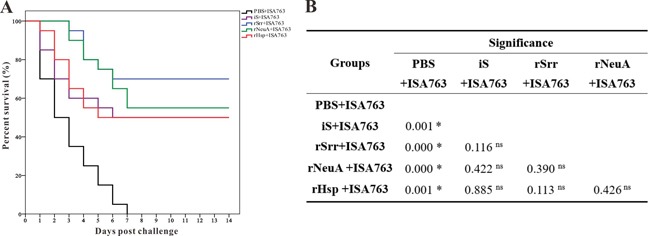
Figure 8. Percent survivals (Kaplan-Meier) of vaccinated fish (n=20) during the challenges tests at 4 week b.v.

A. Differences among groups were tested using the log-rank test shown in B.. “*”Denotes significant difference (p < 0.05), “ns” means not significant.
