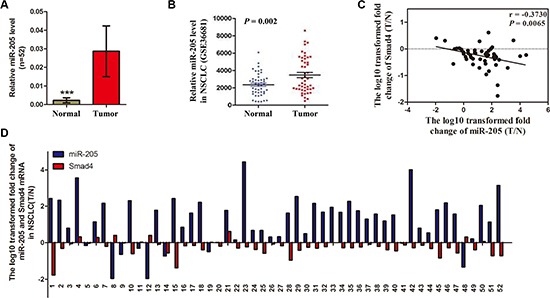
Figure 5. Expression of miR-205 is upregulated in NSCLC tissues and inversely correlated with SMAD4 expression.

(A) Relative miR-205 levels in 52 NSCLC tissues (T) and paired noncancerous lung tissues (N). (B) Scatter diagram showing relative SMAD4 mRNA expression levels of NSCLC tumors and adjacent normal lung tissues in a public data set (GSE36681). (C) Correlation between the miR-205 level and SMAD4 mRNA expression in 52 paired NSCLC tissues. MiR-205 and SMAD4 mRNA levels are expressed as relative indexes normalized against U6 and β-actin, respectively. The x and y-axes represent the log10 transformed fold change of T/N mRNA expression ratios of miR-205 and SMAD4, respectively. (D) Relative expression of miR-205 levels and SMAD4 mRNA in 52 paired NSCLC tissues. The y-axis represents the log10 transformed fold change of T/N expression ratios of miR-205 levels and SMAD4 mRNA. The number of each specimen is indicated below the x-axis. *P < 0.05; **P < 0.01; ***P < 0.001.
