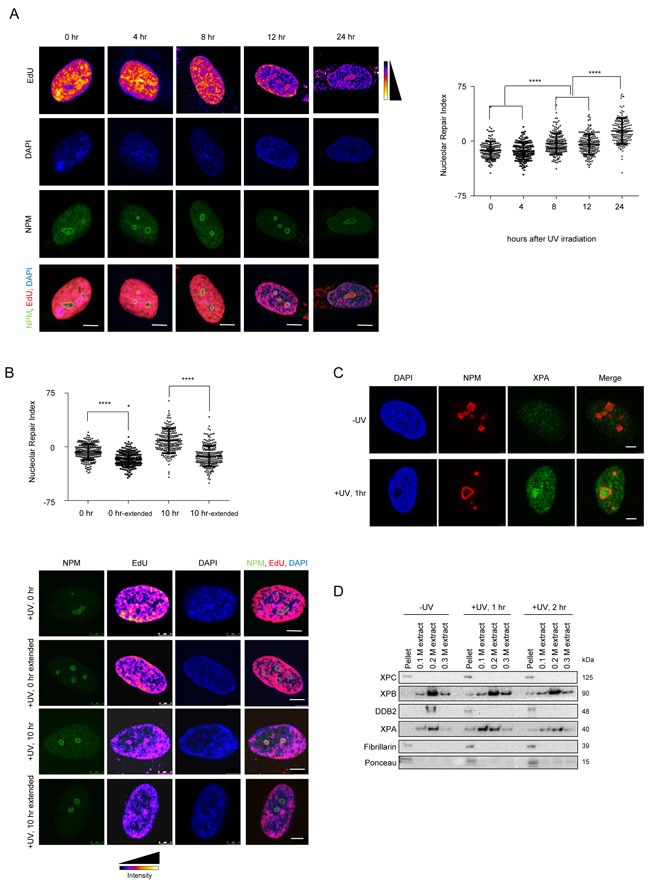
Figure 1. The nucleolus is a site of accumulation of NER proteins as well as active DNA repair.

A. NER occurs in repair foci that colocalize with nuclophosmin (NPM-a nucleolar protein). (Left panel) Representative images of active repair foci indicated by EdU incorporation, at the indicated time points post UV exposure. Cells are co-stained with NPM to show nucleolar overlap of repair foci. Scale bar: 5μm. (Right panel) The graph shows the Nucleolar Repair Index (NRI) values of nucleoli from ≈100 non-S phase cells at the indicated time points post UV exposure. Statistical significance was calculated using a Mann-Whitney test. B. DNA repaired in the nucleolus is later redistributed throughout the nucleus. (Top panel) The graph shows the Nucleolar Repair Index (NRI) values of nucleoli from ≈100 non-S phase cells at the indicated time points post UV exposure, with or without extended repair up to 24 hours (extended) in EdU free medium. Statistical significance was calculated using a Mann Whitney test. (Bottom panel) Representative images of active repair indicated by EdU incorporation, at the indicated time points post UV exposure, stained either immediately after incorporation, or after extended repair in EdU free medium up to 24 hrs (extended). Scale bar: 5μm. C. XPA accumulates in the nucleolus post UV exposure. Immunofluorescence images showing staining of NPM and XPA in pre-extracted cells unexposed to UV, or 1 hour after exposure to a 20J/m2 UV dose. Pre-extraction washes off unbound nuclear and cytoplasmic proteins and enables visualization of chromatin-associated proteins. In UV exposed cells, nucleolar XPA is seen in 73.57% ±10.13 cells. 60-80 cells were counted per replicate. n = 3. Scale bar: 5μm. D. Nucleolar NER proteins are present in the chromatin fraction post UV exposure. Western blot showing sequential salt extraction fractions of nucleoli at the indicated timepoints post UV exposure. The pellet consists of the chromatin bound fraction. E. (Left panel) Immunofluorescence images showing EdU incorporation in MRC5 cells subjected to DNA damage through a micropore of a 3 μm diameter. Cells were incubated with EdU and fixed and stained at the indicated time points after UV damage. Nuclei are shown by DAPI staining, and nucleoli are marked by Nucleophosmin (NPM). Scale bar: 5μm. (Right top panel) Quantification of absolute nuclear intensity of the EdU signal after incubation for the indicated timepoints after micropore UV damage. 70 cells measured per timepoint. (Right bottom panel) The graph shows the Nucleolar Repair Index (NRI) values of nucleoli from ≈70 non-S phase cells at the indicated time points post UV exposure. Statistical significance was calculated using a Mann-Whitney test.
