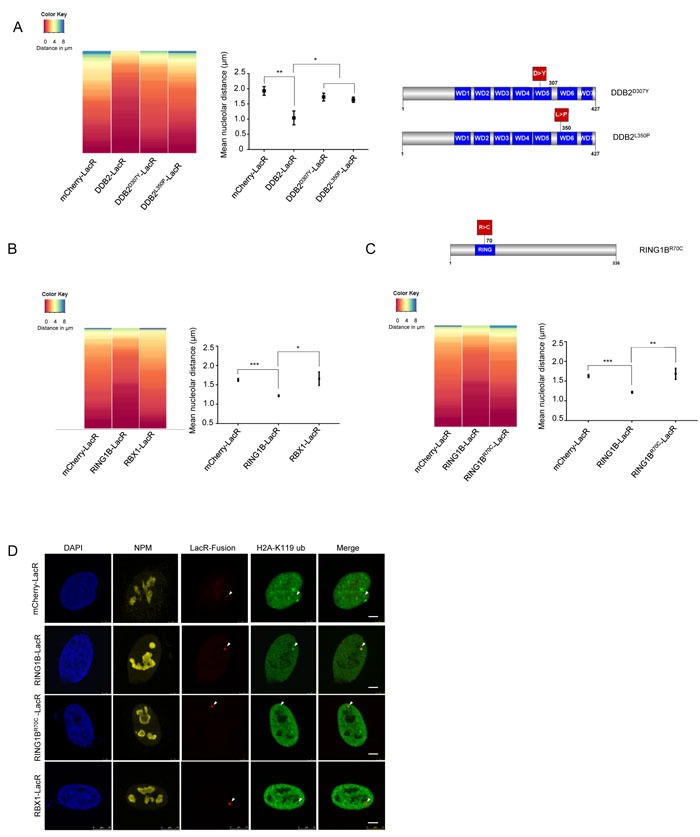
Figure 3. Repositioning of the array is dependent on formation of a functional UV-DDB complex.

A. Tethering of DDB2 mutants does not lead to repositioning of the LacO array. (Left panel) Heat map showing the distribution of the nucleolar distance of the array in 100 cells. Distances were measured in control arrays (mCherry-LacR) and DDB2-LacR, DDB2D307Y-LacR and DDB2L350P-LacR tethered arrays. Relocalization of DDB2 differs significantly from the control array as judged by a KS test. (p value≤ 0.0001). Tethering DDB2D307Y-LacR or DDB2L350P-LacR does not differ significantly from the control. (Middle panel) Mean nucleolar distance of the array in control, DDB2-LacR, DDB2D307Y-LacR and DDB2L350P-LacR tethered conditions. The mean nucleolar distance of each replicate was calculated from measurements of nucleolar distance in 100 cells. The graph shows the average of the means from 3 independent experiments ±SD. Statistical significance was determined using an unpaired t-test. (Right panel) Graphical representation of the DDB2 point mutations used in this study. B. RING1B but not RBX1 tethering leads to repositioning of the array. (Left panel) Heat map showing the distribution of nucleolar distance of the array in 100 cells. Control arrays (mCherry-LacR), RING1B-LacR and RBX1-LacR tethered arrays were analyzed. The distribution of the RING1B-LacR array differs significantly when compared to the control array as judged by the KS test (p value≤ 0.001). (Right panel) Mean nucleolar distance in mCherry-LacR, RING1B-LacR and RBX1-LacR tethered arrays. The mean nucleolar distance of each replicate was calculated from measurements of nucleolar distance in 100 cells. The graph shows the average of the means from 3 independent experiments ±SD. Statistical significance was determined using an unpaired t-test. C. RING1BR70C-LacR tethering does not cause repositioning of the array. (Top panel) Graphical illustration of the RING1B point mutation used in this study (Left panel) Heat map showing distribution of distance of the array from the nucleolus in 100 cells with mCherry-LacR, RING1B-LacR or RING1BR70C-LacR tethered arrays. RING1B-LacR differs significantly from the control as judged by a KS test (p value≤ 0.001). (Right panel) Mean nucleolar distance of the array in mCherry-LacR, RING1B-LacR and RING1BR70C-LacR tethered cells. The mean nucleolar distance of each replicate was calculated from measurements of nucleolar distance in 100 cells. The graph shows the average of the means from 3 independent experiments ±SD. Statistical significance was determined using an unpaired t-test. D. Tethering of RING1B causes deposition of a prominent H2A-K119 ubiquitin mark. H2A-K119 ubiquitin antibody staining in cells with tethered RING1B-LacR, RBX1-LacR or RING1BR70C-LacR. Scale bar: 5μm. The H2A-K119-ubiquitin signal was observed to colocalize with RING1B LacR in 70/100 cells. Colocalization was seen in 0/100 cells for mCherry-LacR, RBX1-LacR and RING1BR70C-LacR.
