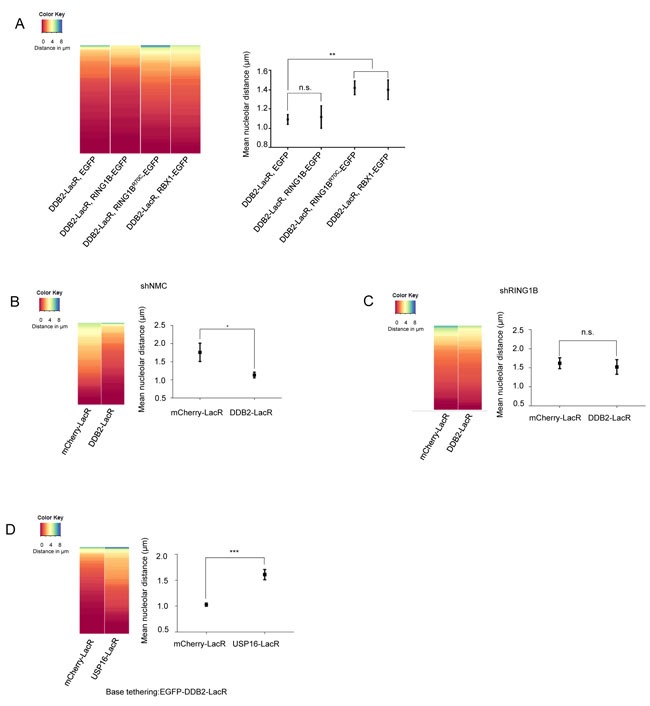
Figure 4. Repositioning of the array is dependent on the H2A-K119-ubiquitin mark set by RING1B.

A. DDB2-LacR mediated repositioning can be attenuated by competition between E3 ligases. (Left panel) Heat map showing distribution of nucleolar distance of the array in 100 cells. Cells with DDB2-LacR tethered arrays, expressing EGFP, RING1B-EGFP, RBX1-EGFP or RING1BR70C-EGFP were analyzed as shown. (Right panel) Mean nucleolar distance of the DDB2-LacR tethered arrays in cells expressing EGFP, RING1B-EGFP, RBX1-EGFP or RING1BR70C-EGFP as shown. The mean nucleolar distance of each replicate was calculated from measurements of nucleolar distance in 100 cells. The graph shows the average of the means from 3 independent experiments ±SD. Statistical significance was determined using an unpaired t-test. B., C. Knockdown of RING1B abolishes repositioning of a DDB2-LacR tethered array. (Left panel) Heat map showing distribution of the nucleolar distance of the array in 100 cells. mCherry-LacR or DDB2-LacR tethered arrays were analyzed in a control (shNMC) or RING1B knockdown (shRING1B) background. There was no significant difference between the control and DDB2-LacR tethered array in the shRING1B cells as judged by a KS test. (Right panel) Mean nucleolar distance of the control and DDB2-tethered array in shNMC or shRING1B cells. The mean nucleolar distance of each replicate was calculated from measurements of nucleolar distance in 100 cells. The graph shows the average of the means from 3 independent experiments ±SD. Statistical significance was determined using an unpaired t-test. D. Co-tethering of USP16-LacR abolishes repositioning of a DDB2-LacR tethered array. (Left panel) Heat map showing nucleolar distance of the array in 100 cells. EGFP-DDB2-LacR (base tethering) was co-tethered to the array along with either mCherry-LacR or mCherry-LacR-USP16. Co-tethering of USP16 leads to a significant repositioning of the array as judged by a KS test (p value≤ 0.0001). (Right panel) Mean nucleolar distance of the DDB2-LacR tethered array with mCherry-LacR and USP16 LacR co-tethering. The mean nucleolar distance of each replicate was calculated from measurements of nucleolar distance in 100 cells. The graph shows the average of the means from 3 independent experiments ±SD. Statistical significance was determined using an unpaired t-test.
