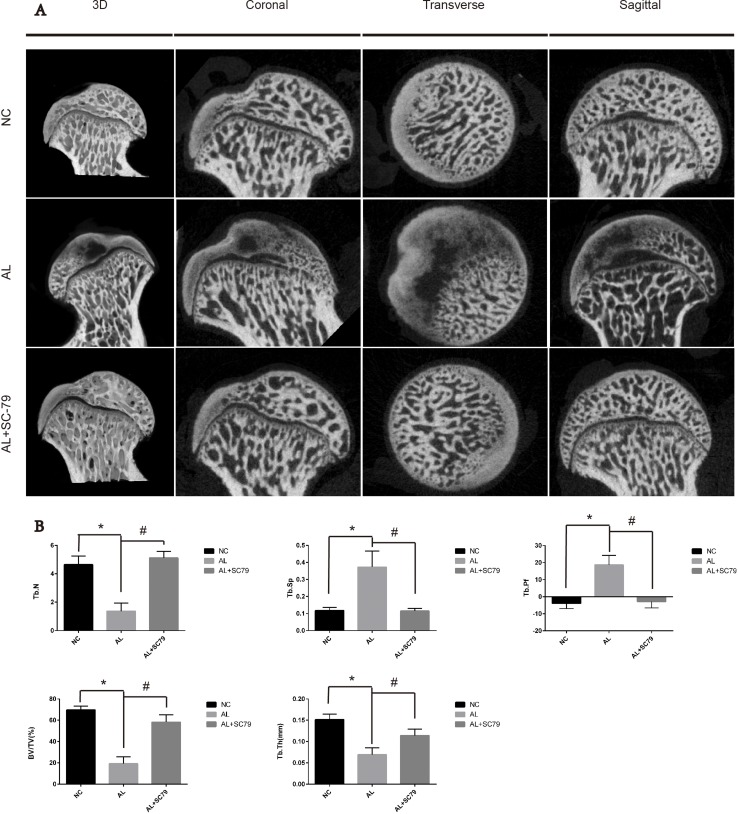
Figure 6. Micro-CT scanning and analyses.
(A) Micro-CT scanning images of the femoral head divided by group and section. Significant less subchondral trabecular bone was observed in the AL group compared with the NC group while more was observed in the AL+SC-79 group. (B) Values are represented as mean ± SD. (N = 5 for each group; *significant difference between the AL and the NC groups, p < 0.05; #significant difference in the AL+SC-79 compared to the AL group, p < 0.05). BV/TV: bone volume/tissue volume; Tb.Th: trabecular thickness; Tb.Sp: trabecular separation; Tb.N: trabecular number; Tb.Pf: trabecular pattern factor.

