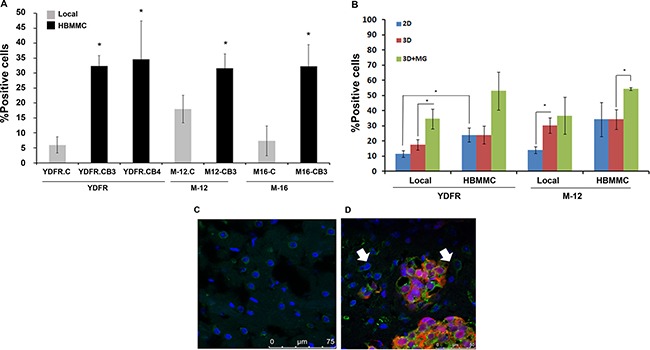
Figure 1. CCR4 is upregulated in brain-tropic melanoma cells.

(A) FACS analysis for CCR4 expression by local melanoma variants compared to brain metastasizing melanoma variants (HBMMC) from 3 different melanomas (YDFR, M-12, M-16). Graphs show the average % positive cells in three independent experiments, *p < 0.05. (B) FACS analysis for CCR4 expression of local and of brain metastasizing melanoma cells (HBMMC). Melanoma cells grown in 3D cultures (3D) express higher levels of CCR4 than cells grown in 2D cultures (2D). Addition of microglia-derived soluble factors to melanoma cells grown in 3D cultures (3D+MG) upregulated the expression of CCR4 even more. Graphs show the average % positive cells in three independent experiments, *p < 0.05. (C–D) Brain sections of normal mice (C) and of mice inoculated via the intra-cardiac route with 1 × 10⁶ mCherry-HBMMC (D). Brain sections were stained by immunofluorescence for CCR4 (green). Melanoma macrometastases are red and cell nuclei are blue (DAPI), Magnification: ×63. Scale bar = 75 μm (C), Scale bar = 50 μm (D). Arrows indicate CCR4 expressing stromal cells in the brain microenvironment.
