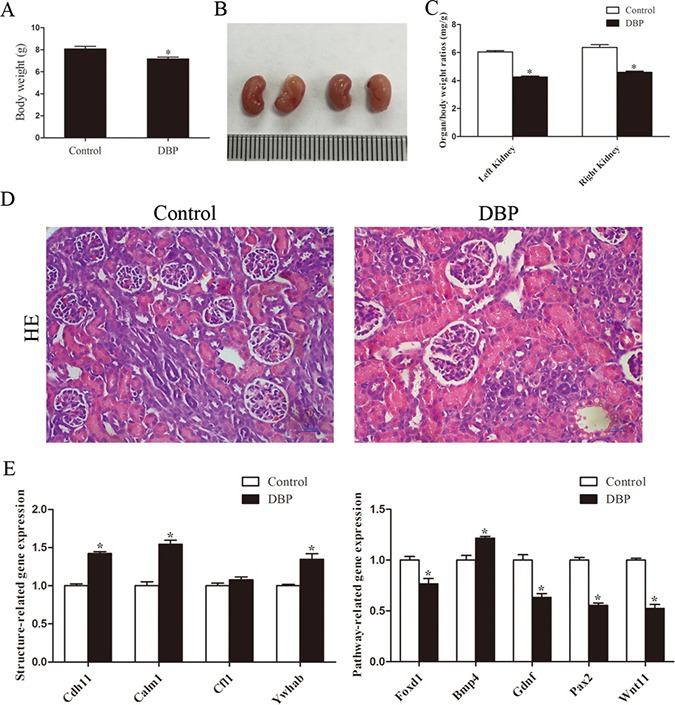
Figure 1. Maternal exposure to DBP induces kidney dysplasia in rat offspring on PND1.

(A) The body weight of the rat offspring in the DBP-exposed group and DBP-unexposed controls on PND1. (B) Gross images of the kidneys in the DBP-exposed group and DBP-unexposed controls on PND1. (C) The organ/body weight ratio of the kidneys in the DBP-exposed group and the DBP-unexposed control group on PND1. (D) H&E stained images of kidney tissue showed differences between the control and DBP-exposed offspring on PND1. (E) Real-time PCR assessed the expression of genes involved in renal development (Foxd1, Gdnf, Pax2, Wnt11, Bmp4, Cdh11, Calm1, Cfl1, Ywhab) in the kidneys of DBP-exposed rats and DBP-unexposed controls on PND1. Data represent mean ± SD. n = 6 rats per group, *P < 0.05.
