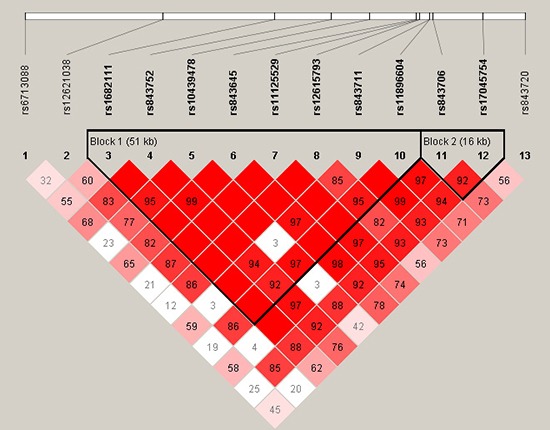
Figure 1. Haplotype block map for part of the SNPs in ACYP2 gene.

Linkage disequilibrium plots containing thirteen SNPs from 2p16.2. Standard color frame is used to show LD pattern. Two blocks in the figure showed higher LD. Red squares display statistically significant associations between a pair of SNPs, as measured by D’; darker shades of red indicate higher D’.
