
Figure 3.
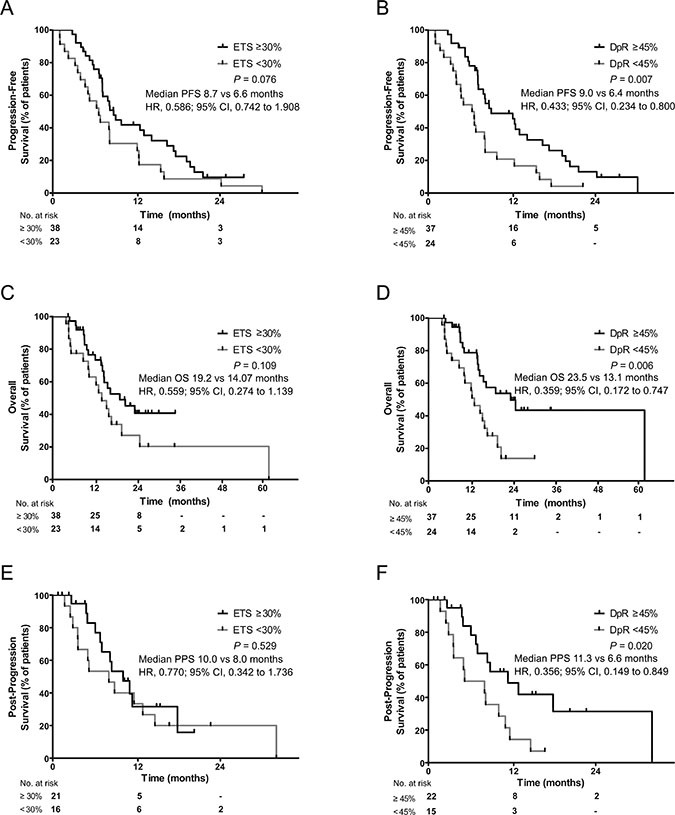
Kaplan-Meier curves for progression-free survival (A, B), overall survival (C, D), and post-progression survival (E, F) in relation to early tumor shrinkage (cutoff ≥ 30%; A, C, E) and depth of response (cutoff ≥ 45%; B, D, F). ETS, early tumor shrinkage; DpR, depth of response.